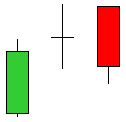
Bearish Weekly Doji: This scan identifies stocks that have experienced a recent uptrend on the weekly chart and, on the prior trading day, opened and closed at the same price. Additionally, the stock is experiencing current weakness and is moving lower following the Doji, or same open and close price. This would indicate a reversal and potential pressure to the down side.
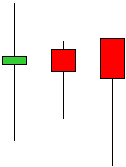
Bearish Engulfing: Bearish Engulfing patterns occur when a stock closes higher than its opening price during the period. The following period has a pattern of a higher high and lower low during the period, but closes below the prior period’s low. When these to consecutive period patterns are met, the stock lands on the Bearish Engulfing scan list and is a potential sell candidate.
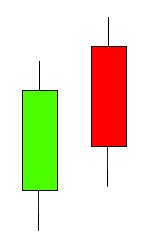
Dark Cloud Cover: Dark Cloud Cover is a Candlestick pattern that indicates a potential downtrend. This pattern occurs over two periods. In the first period a stock closes above its open for the period. During the following period, the stock opens above the prior period’s close and closes both below the current period’s open and below the mid-point of the prior period’s range. This indicates a potential short selling opportunity.
Hanging Man: The hanging man is a bearish reversal pattern that can also mark a top or resistance level. Forming after an advance, a hanging man signals that selling pressure is starting to increase. The Hanging Man chart pattern confirms that sellers pushed prices lower during the session. Even though the bulls regained their footing and drove prices higher by the finish, the appearance of selling pressure raises the yellow flag. As with the hammer, a hanging man requires bearish confirmation before action. A sharp sell off after this pattern will trigger a stock to make this scan list.
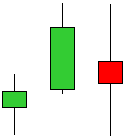
Bearish Harami: A trend indicated by a large candlestick followed by a much smaller candlestick whose body is located within the vertical range of the larger candle's body. Such a pattern is an indication that the previous upward trend is coming to an end. A bearish harami may be formed from a combination of a large white or black candlestick, and a smaller white or black candlestick. The smaller the second candlestick, the more likely the reversal. It is thought to be a strong sign that a trend is ending when a large white candle stick is followed by a small black candlestick.
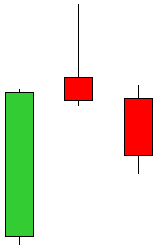
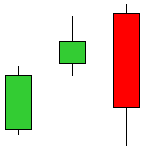
Evening Star: A bearish candlestick pattern consisting of three candles that have demonstrated the following characteristics:
1. The first bar is a large white candlestick located within an uptrend.
2. The middle bar is a small-bodied candle (red or white) that closes above the first white bar.
3. The last bar is a large red candle that opens below the middle candle and closes near the center of the first bar's body.
Evening star formations can be useful in determining trend changes, particularly when used in conjunction with other indicators. Many traders use price oscillators and trend lines to confirm this candlestick pattern.