Sweet Spot Calculation
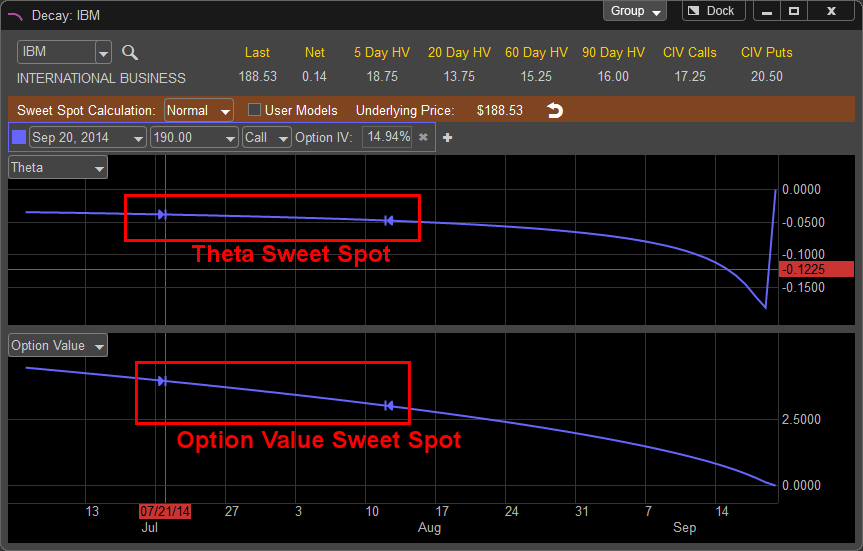
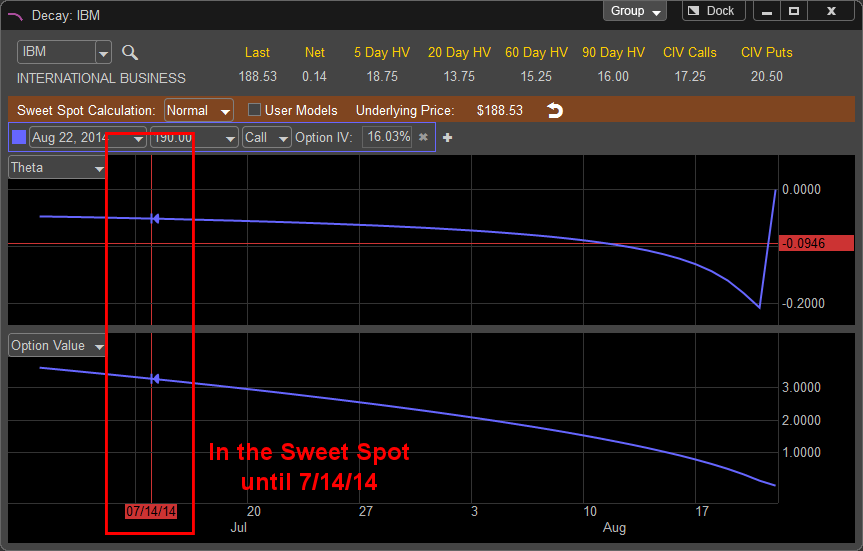
The Sweet Spot Calculation is represented by two arrow icons. This calculation represents the best areas of Theta where the option is at its maximum time premium before the Theta starts to decay at a rapid pace. If you only see one arrow on the graph this implies that you are in the sweet spot currently and the second arrow will show you were the current sweet spot ends.

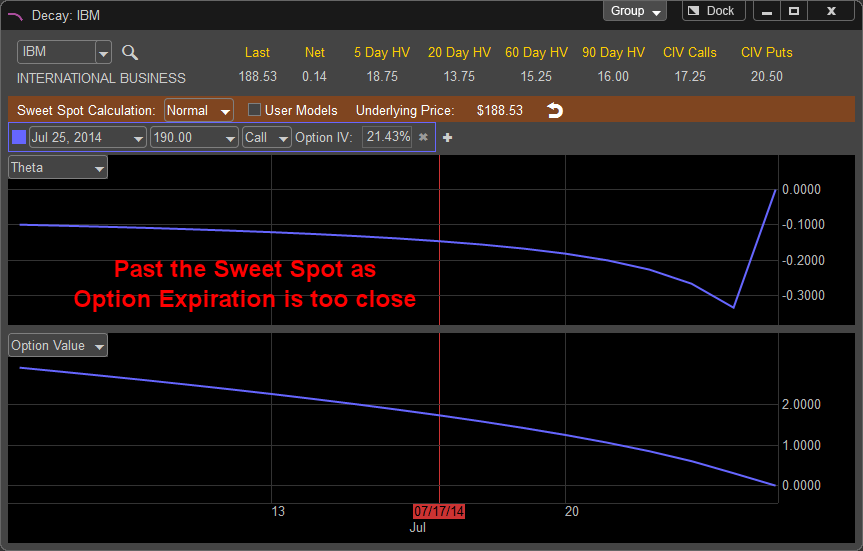
The Sweet Spot can be calculated in either an Early or Normal mode. This can be changed by using the Sweet Spot Calculation drop down menu. Simply, left click on the arrow to the right of the drop down and select Early or Normal, once selected the graph will change automatically.
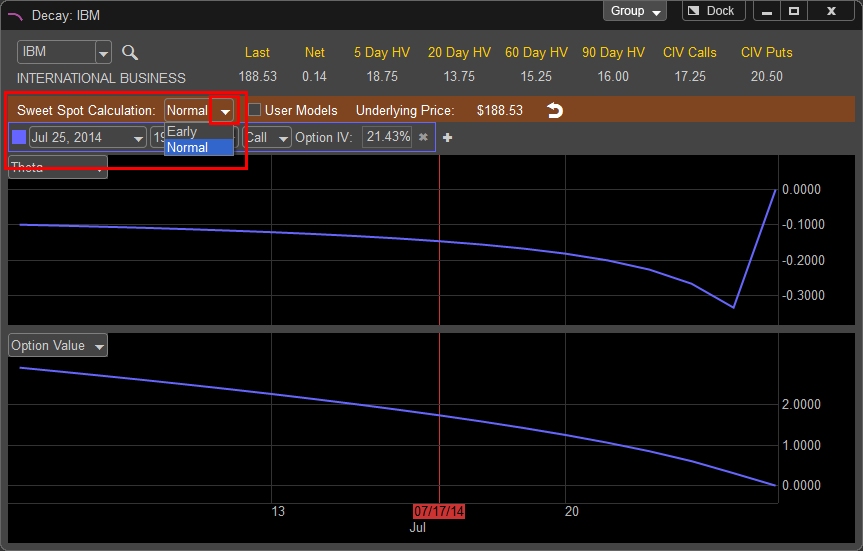
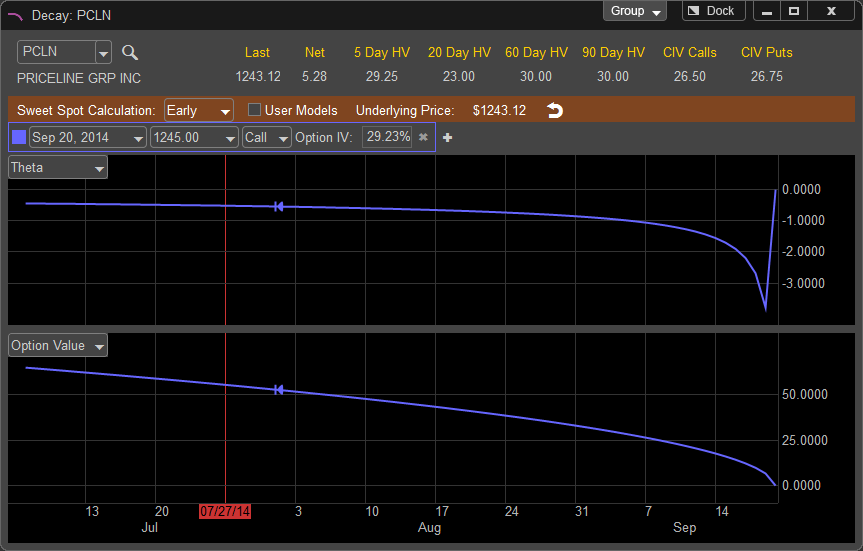
Early: The Early mode attempts to find Time and Theta windows that allow you to maximize monetary return by identifying the area before Theta begins to erode the option value. This is an aggressive method because you selling the call on an earlier date to take to take maximum advantage of the Theta Decay. However, in doing this you are also allowing more time for the underlying issue to move against you in price.
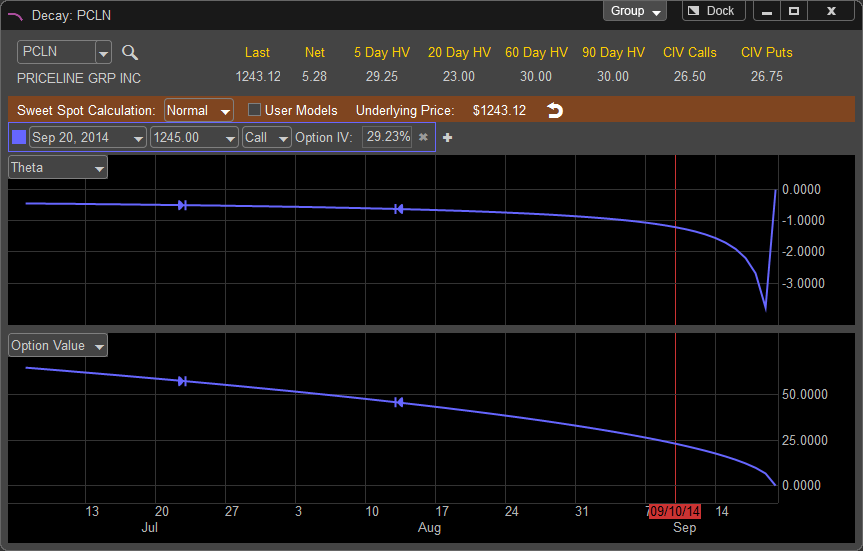
Normal: The Normal mode identifies the last time area before Theta begins to greatly de-value the option premium. This is viewed as Conservative because it leaves less time for the option to gain value based on the movement of the underlying stock.
Early Vs. Normal Comparison of PCLN, as displayed the Early Sweet Spot Calculation will allow a longer hold time allowing for more Theta Decay on the Covered Call.
