![]()
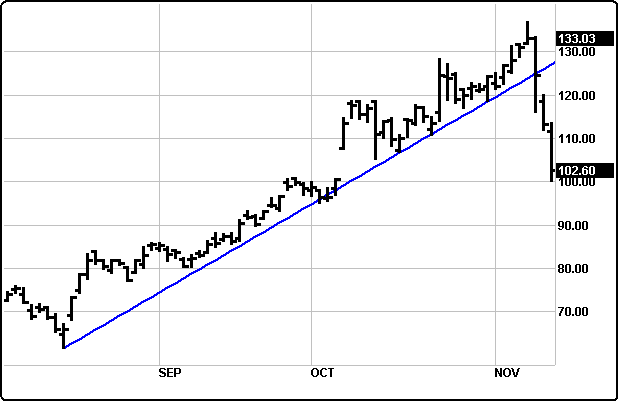
A trend line is a straight line that connects two or more price points to act as a line of support or resistance. Trend Lines are an important tool in technical analysis for both trend identification and confirmation.
Many people believe that prevailing trends, either up or down, will determine where a security is headed. The trend line can represent either support as in an uptrend line or resistance as in a downtrend line. Consolidations can be marked by horizontal trend lines.
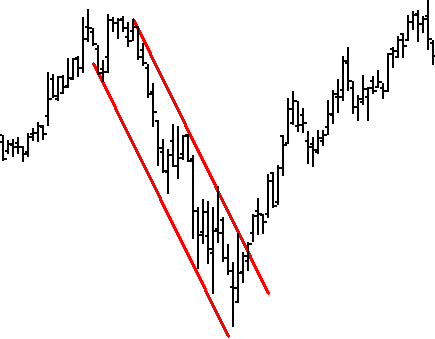
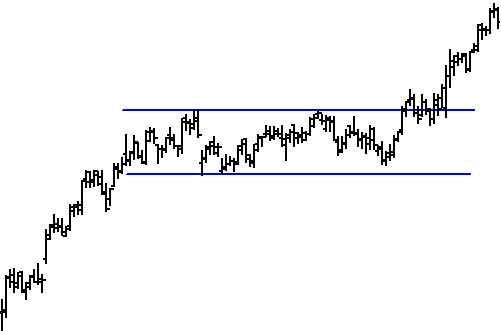
Lines drawn in the up-trend direction will be blue in color, while lines drawn in the down-trend direction will be red in color.
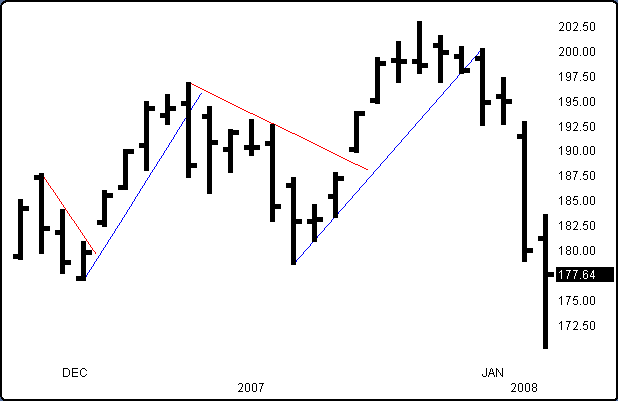
To draw a trend line select it from the toolbar shown below. Once it is selected left click the first point on the chart then left click the second point on the chart and the line will be drawn.
Editing Lines
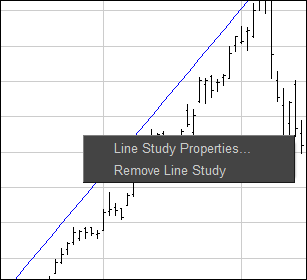
Once a line has been drawn on the Chart, right click on the line and select Line Study Properties, shown below:
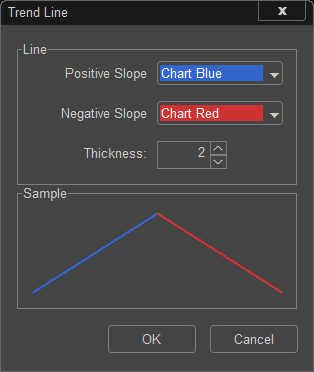
The default colors for the lines are shown to the left, a line that is positive or sloping up is Blue and a line that is negative or sloping down is Red. The Thickness of the lines that are drawn is set to 1. If a thicker line is desired, increase the thickness and click OK.
How to Use Trend Lines
Trend line analysis is a line drawing technique where we connect a series of descending tops or bottoms to other price pivot point swing moves. Once a trend line is broken through in a price movement, it can very often signify an improved potential for a bigger price movement at that time.
Trend line analysis has been around for decades. It has been used in technical analysis when charts were drawn by hand on paper, long before the advent of computerized charting programs. Trend line analysis can be one of the simplest chart reading methods a technical trader can use for identifying and trading support and resistance levels on charts. It can be highly effective technique to use as a trading tool.
Trend line analysis can be used on any type of stock, futures contract, index, or for Forex currency trading. It can also be useful for just about any trading time frame.
A trend is called an uptrend when we have higher lows and a downtrend when we have lower highs. A trend line can be used is the direction of the price movement which is formed by different peaks and valleys (highs and lows). The end of a particular trend is said to be over when the price trades through a trend line and cannot quickly trade back into the trend line break.
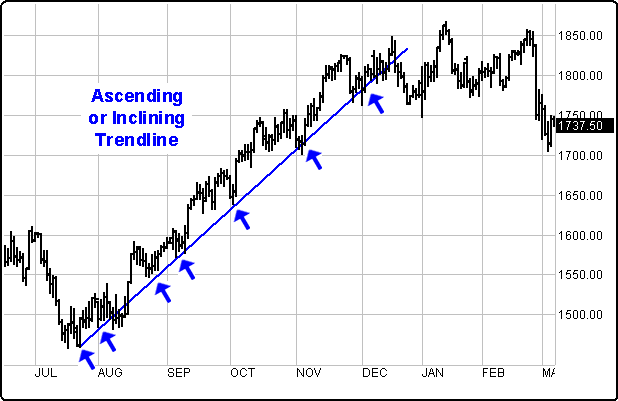
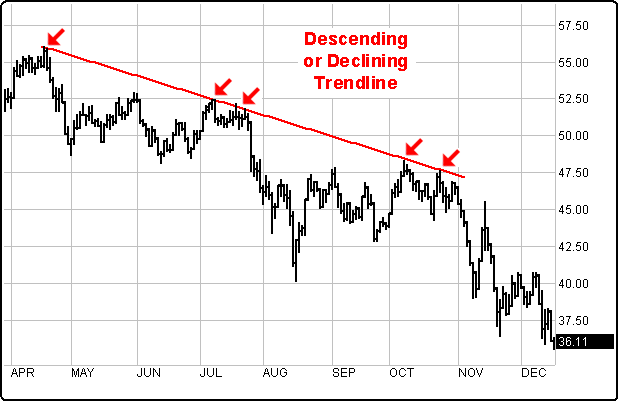
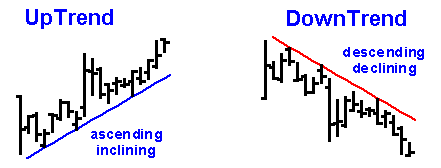
There are two basic types of trend lines - ascending or inclining trend line (something going up), descending or declining trend line (something going down).
A trend line that supports can become a resistance trend line, or vise versa. If the price movement is above a trend line that trend line is said to support that line. If the price movement is below the trend line a price movement that moves toward that trend line is said to have resistance at that trend line.
The bigger the trend, the stronger the trend line becomes as a support or resistance tool. Small trends can exist within bigger trends. Breaks of the smaller trends within the bigger trends can signify a return of that bigger trend.
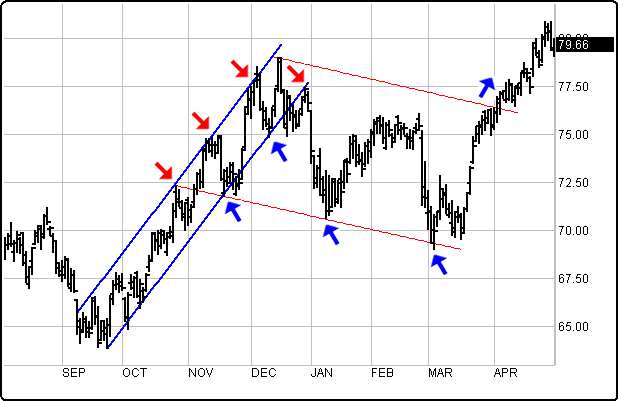
Prices can trend within parallel trend lines. Traders will attempt to buy and sell as the price approaches one of the parallel trend lines. When a parallel trend line is broken it often signifies the new trend continuing.
The stronger the trend and the steeper the trend line angle, typically the greater the breakdown potential once a trend line is finally broken.
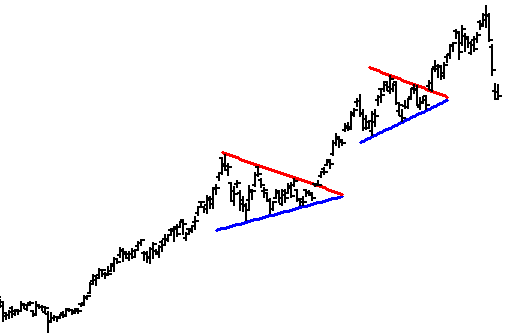
Prices can trade within trend lines that develop recognizable patterns that traders often times will have good success trying to trade. Some strong patterns technical traders look for are things like triangle, flags and pennants, and wedge chart patterns. Previous tops and bottoms can form recognizable patterns such as double or triple tops or bottoms, or something called a "head and shoulder" or irregular head and shoulder pattern. We can often times apply a simple trend line and monitor for a trend line breakdown to signify a major change-in-trend, or the end of the previous major trend. When a price moves outside those patterns types of charting patterns the trend is said to either be continuing in the direction of the break, or it becomes a significant breakdown in the previous trend.
Basic Recognizable Patterns to Monitor For When Using Trend line Analysis
Below are some of trend line patterns most traders try to find so they can draw our insights which direction to try and trade:
Up or Down trend line- an uptrend or downtrend where you draw a straight line using the price bar lows to define the trend support and eventual breakpoint.
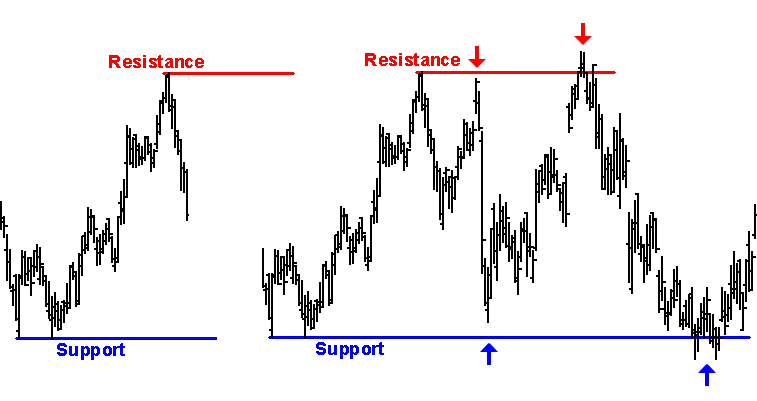
Support or Resistance Trend line- a support (floor) or resistance (ceiling) can be identified when you draw a horizontal trend line from a previous chart pivot point high or low or minor pivot points where price swings occur. The larger the swing the stronger the horizontal trend line support or resistance becomes.
Uptrend or Downtrend Channel Trend lines- this is a trend line channeling technique where parallel trend lines contains price movements. The upper channel trend line serves as a resistance area and the lower channel trend line serves as a support. A break of either channel line typically can indicate a new trend or continuation of a previous trend to now focus on.
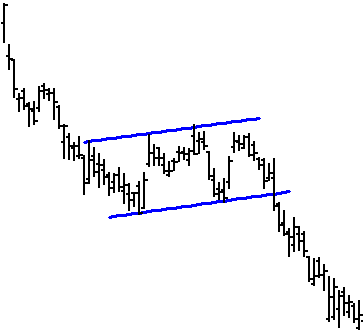
Horizontal or Sideways Channel Trend lines- this type of channeling technique is useful for identifying support and resistance price movements in markets that are moving in a sideways pattern. If a horizontal or sideways trading channel occurs early in a trend a breakout of a trend line usually indicates a strong trending characteristic. Narrow band horizontal corrections can often become some of the very best trends to catch.
Triangle Trend line- this type of a chart pattern is not always easy to identify at first but after more time passes and the price movement begins to oscillate within previous pivot swing moves, a triangles can become powerful trading patterns worthy of further tracking for the eventual breakouts. Once a breakout takes place, a powerful trend can very well springboard quickly further in the breakout direction.