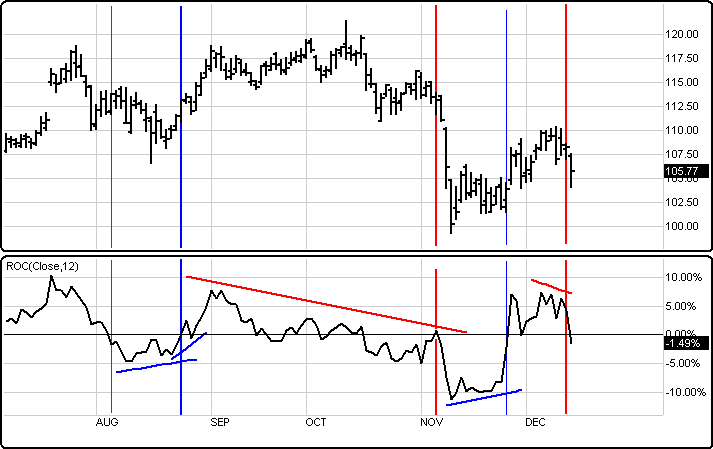
Rate of Change (ROC) is a momentum oscillator or a velocity indicator measuring the percent change in price from one period to the next. It compares the current price with the price "n" periods ago.
ROC works like an oscillator fluctuating from zero (0) above and below as the rate of change moves positive to negative. When a Rate of Change (ROC) becomes greater than 0 it indicates upward momentum increases. A rising ROC indicates a bullish increasing momentum. When a Rate of Change (ROC) becomes less than 0 it indicates downward momentum or a selling pressure increase, indicating a bearish decreasing momentum.
We look for positive or negative divergences at a higher low or lower high peaks and troughs, and for crosses above and below zero, for trading signals. When ROC hits extreme highs it can be considered overbought. When it reaches extreme lows it can also be interpreted as an oversold condition.
Rate of change (ROC) is not a primary or stand alone indicator. Essentially Rate of Change (ROC) has a horizontal median called equilibrium and from that median we can gauge the degrees of rate of change as they oscillate from one extreme to another. Some use the crossover of zero to confirm sell and buy actions. Because ROC is not always a good stand alone indicator, it is wise to use ROC as a secondary indicator to support other better setup signals.
Rate of Change (ROC) vs the "Momentum" Indicator- Another indicator called Momentum (MOM) is almost identical to the Rate of Change (ROC) indicator. The only difference is the ROC adds 100 to the value. MOM uses 100 as its center line instead of zero. Those who are use to using MOM can simply replace it with the ROC calculation.
Menu:
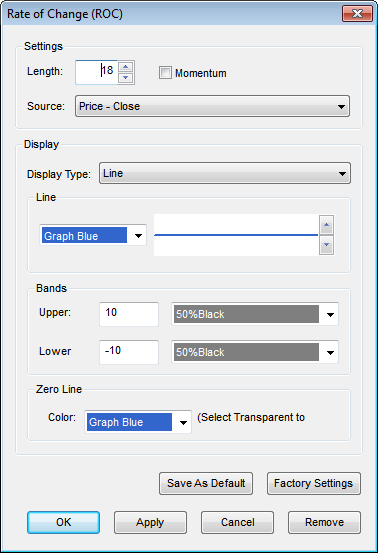
Settings
The Default Length is 18 (trading days) and the Offset is 0. These values can be changed by clicking in their respective boxes and changing the values. As well the Momentum Check Box can be selected to enable the Momentum for the Study.
The Source can be set to one of the following options: Price - Open, Price - High, Price - Low, Price - Close, Price - Volume
Display
The Display Type can be set to one of the following options: Line, Line with Bands, Line with Bands and Shading, Line with Shading.
Line
The Color selection allows the user to change the color of the band & the Thickness selector allows the user to change the thickness of the band displayed.
Bands
The default Upper Band is set at 10 while the Lower band is set at -10. These values can be changed by clicking in their respective boxes and changing the values. The Color selection allows the user to change the color of the band displayed.
To save your modified settings to be applied to future charts, click Save As Default. Once this is clicked at all times in the future the settings you have set will be applied to future charts when this study is added.
To return to the Factory Settings, click Factory Settings and then click Save As Default. Once this done at all times in the future the Factory Settings will be applied to future charts when this study is added.
Click Ok to apply the Rate of Change (ROC) to the selected chart or click Cancel or Remove to exit the study without applying it.
Click Remove to remove the study from the selected chart.