Definition: The Relative Strength Index (RSI) is an indicator developed by J. Welles Wilder and is discussed in his 1978 book New Concepts in Technical Trading Systems. RSI compares the magnitude of a stock's recent gains to the magnitude of its recent losses. RSI can be considered as a momentum indicator because it measures an internal strength compared to past prices. The RSI formula converts the price action into a number between the range of 1 to 100. The higher the number, the more overbought; the lower the number, the more oversold. In its simplest form, RSI is considered overbought above 70 and oversold below 30.
When a stock is identified as overbought or oversold, it becomes vulnerable to a trend reversal.
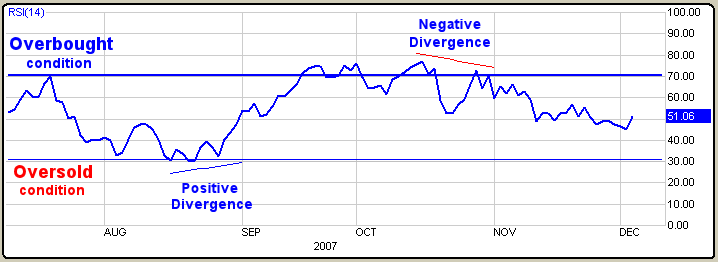
How to Use: Reversal patterns often occur after bullish or bearish divergence appears. Bearish divergence takes place when the stock makes a new high, while the RSI makes a lower high. Bullish divergence occurs when a stock makes a new low while the RSI makes a higher low.
RSI can help identify turning points before confirmations or divergences appear. RSI can also be used to identify overbought and oversold conditions when the RSI value reaches extreme highs or lows.
On average, when an RSI reaches the 70 level, you should consider selling. If a market is extremely bullish, it can extend to a higher area such as 80 or higher. Likewise, if the RSI approaches the 30 area, it is nearing a buy level. For extremely strong bear markets, it might gravitate to the 20 or lower area.
RSI has a weakness in that it is considered a lagging indicator. However, it can create false buy and sell signals when used by itself; therefore, many consider it a secondary or complimentary indicator to be used more effectively with other tools such as a Stochastic or MACD.
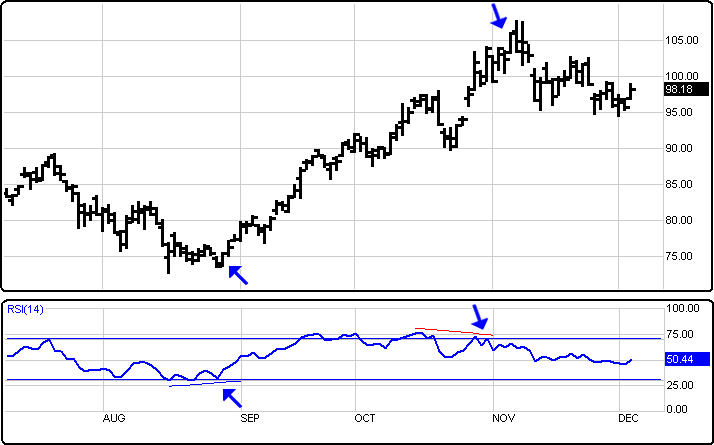
Below is a very simple example of RSI being used as an indicator. Apache (APA) approaches 70. (An oversold condition that continues until a positive divergence is defined—signaling a possible buy.) As APA begins to rise, a new uptrend is established. An overbought condition begins to form within a month as the APA approaches 70, but it stays bullish for another month until a negative angle divergence appears—signaling a possible sell setup. Because the sell signal APA has drifted lower, it has yet to establish a new downtrend. This is an example of how RSI interpretations could be better understood if used in conjunction with other technical analysis tools such as Stochastics, MACD, Elliott Wave theory, and other oscillators.
Menu:
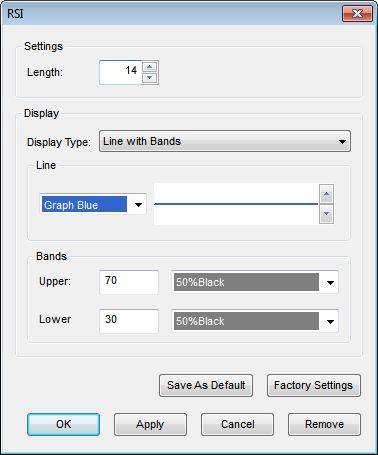
Settings
The Default Length is 15 (trading days). This value can be changed by clicking in the respective box and changing the value.
Display
The Display Type can be set to one of the following options: Line, Line with Bands, Line with Bands and Shading, Line with Shading.
Line
The Color selection allows the user to change the color of the band & the Thickness selector allows the user to change the thickness of the band displayed.
Bands
The default Upper Band is set at 70 while the Lower band is set at 30. These values can be changed by clicking in their respective boxes and changing the values. The Color selection allows the user to change the color of the band displayed.
To save your modified settings to be applied to future charts, click Save As Default. Once this is clicked at all times in the future the settings you have set will be applied to future charts when this study is added.
To return to the Factory Settings, click Factory Settings and then click Save As Default. Once this done at all times in the future the Factory Settings will be applied to future charts when this study is added.
Click Ok to apply the RSI to the selected chart or click Cancel or Remove to exit the study without applying it.
Click Remove to remove the study from the selected chart.