On Balance Volume (OBV) was developed in 1963 by Joseph Granville. He developed it as a momentum indicator that measures positive and negative volume flow. On Balance Volume (OBV) is a running total of volume used to help determine if money is flowing in or out of a particular market in a consistent way. The total volume is assigned a positive value if prices close higher or a negative value if prices close lower. The total is kept by adding or subtracting each day's volume based on the direction of the close. The direction of the OBV line is regarded as more important than the actual volume numbers.
Granville believed volume played a major roll in identifying driving forces behind markets. He believed if traders focused on volume activity, they could better anticipate trends or changes in trend and more successfully trade the changes.
OBV monitors market sentiment. It alerts traders to a changing market situation. This alert may be used as a signal to take a long position on upside breakouts, and selling short when the OBV makes a downside breakout. Traders typically hold positions until the trend changes.
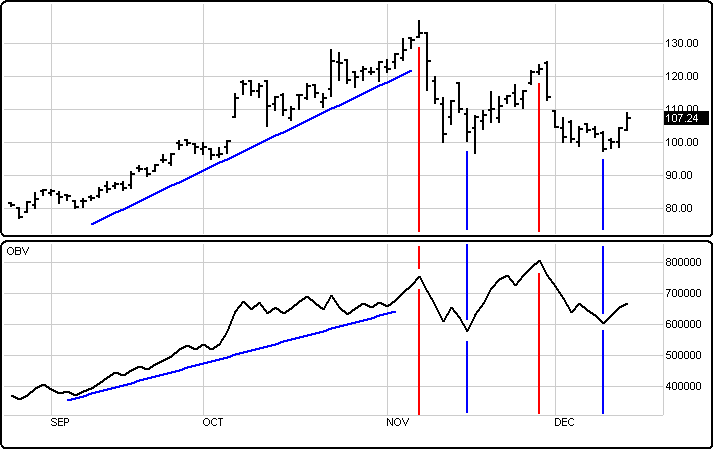
OBV can be used to pick up larger scale institutional money flowing into a stock by a rising OBV. When we talk about institutional money such as: large trading companies, fund managers (pension, investment, hedge, mutual, sovereign state), or any entity that manages a considerable amount of money. It is called "smart money" because smart traders don't trade against it. When a stock is heavily invested in, it expands the OBV further. Once an OBV trend is established it remains in force until broken.
When smart money volume is apparent, institutions are buying the stock of the average investor at the bottom and then selling it back to him at or near the top. On the example below notice how the OBV indicator can suggest major trend line turnarounds.
Menu:
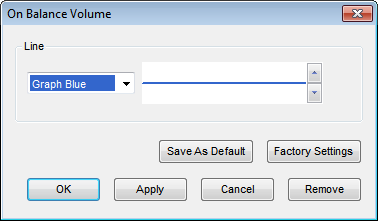 Line
Line
The Color selection allows the user to change the color of the band & the Thickness selector allows the user to change the thickness of the band displayed.
To save your modified settings to be applied to future charts, click Save As Default. Once this is clicked at all times in the future the settings you have set will be applied to future charts when this study is added.
To return to the Factory Settings, click Factory Settings and then click Save As Default. Once this done at all times in the future the Factory Settings will be applied to future charts when this study is added.
Click Ok to apply the On Balance Volume to the selected chart or click Cancel or Remove to exit the study without applying it.
Click Remove to remove the study from the selected chart.