Definition: The Fibonacci Retracement is a tool designed to identify support and resistance levels during a pullback within a trend or swing. Retracements are temporary price reversals that take place within a larger trend and can be used to enter positions in the direction of the larger trend. Support and resistance levels also provide significant stop-loss levels for money management purposes. Fibonacci analysis can be used for day, swing or long-term trading.
There are different approaches to using retracements in trading. A standard approach is to monitor for retracements of 38%, 50%, or 62% before entering a position.
In very bullish markets, traders may be more willing to trade minimal 25% and 38% pullbacks before the uptrend returns. Contrarian or bottom/top-picking traders will only look for more extreme retracements such as 50%, 62%, and 75% pullbacks, in anticipation of potentially larger moves.
Bearish traders will use Fibonacci Retracements in the same manner; however, they look for a rally within a downtrend to enter a short position in the direction of the main trend.
How to Use:
1. Click on the Fibonacci Retracement button ![]() and your cursor will change from an arrow
to the Fib Ret. then click on a high or low point on the chart to set
the first point of the Fibonacci Retracement. Move your mouse to
the next point. If you clicked on a high, you should be looking for a
low; likewise, if you clicked on a low, you should be looking for a high.
and your cursor will change from an arrow
to the Fib Ret. then click on a high or low point on the chart to set
the first point of the Fibonacci Retracement. Move your mouse to
the next point. If you clicked on a high, you should be looking for a
low; likewise, if you clicked on a low, you should be looking for a high.
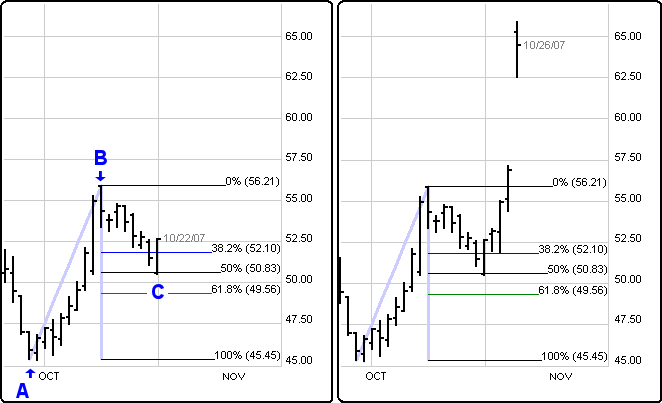
For example, if, while buying into an uptrend, you see evidence of a potential pullback, click the mouse at the low point (A) of the beginning of that trend to set the first retracement calculation start point. Then move the mouse to the current high (B) and click at the current high to finalize the coordinates of the two points. This calculates the distance of that trend and will now display the retracement calculations (C).
2. Click on the second point (either a high or low). This will be the distance used for calculating the swing length.
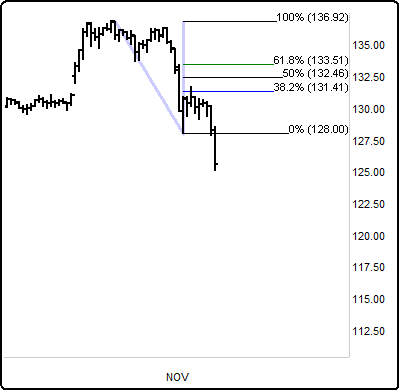
In the following example, focus on potentially buying the next pullback in this stock. Fibonacci Retracements can be applied by clicking on the low (A); then, by clicking on the immediate high (B), you can review the key (default settings are 38%, 50%, and 62%) retracement support areas.
In this example, it holds at the 50% retracement. It then continues the trend back up.
Editing Fibonacci Values
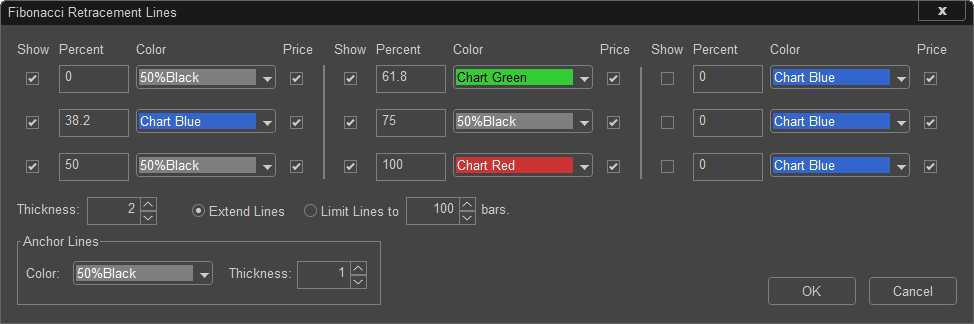
Once the Fibonacci Retracement lines have been drawn on the Chart, right click on the line and select Line Study Properties.(shown below)
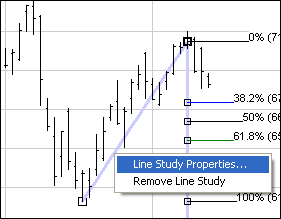
When viewing the Line Study Properties dialog box there are many options available. You can modify any of the lines listed above. When adding or editing a line you can set whether you want it to be displayed, the percent, whether to show the price, the color of the line and the thickness of the lines.
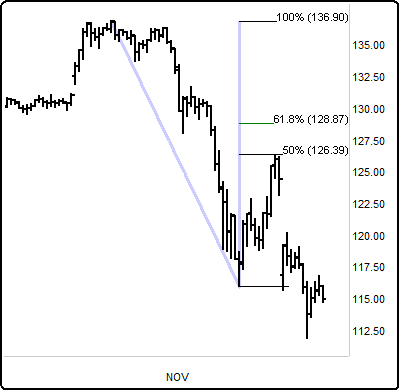
Below is an example of how Fibonacci Retracements can be used to trade intermediate swing moves. Attempt to get a Short on a chart at the beginning of a new downtrend. Then review the sharp selling at the open of the market and track it for a retracement to enter a Short position. In this example, the 38% retracement identified the resistance level.
After it sells off, if you believe the downtrend will continue, you can again use Fibonacci Retracement levels to identify a rally into resistance areas. Some bearish traders would attempt to sell short at 50% to 62% resistance area.
Fibonacci ratios is a widely used approach for measuring price movement regardless of the trading style. For example, Elliott Wave traders use the Fibonacci sequences to identify waves or patterns in their trading strategy.
The most common Fibonacci ratios used in the stock markets are:
0.15, 0.25, 0.38, 0.5, and 0.62 (ratios)
1, 1.62, 2.62, 4.25, and 6.85 (multiples)
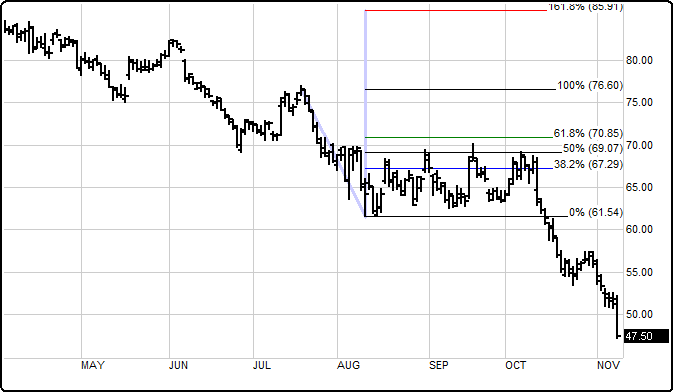
Below are further examples on how to apply Fibonacci Retracements in uptrend or downtrend markets.
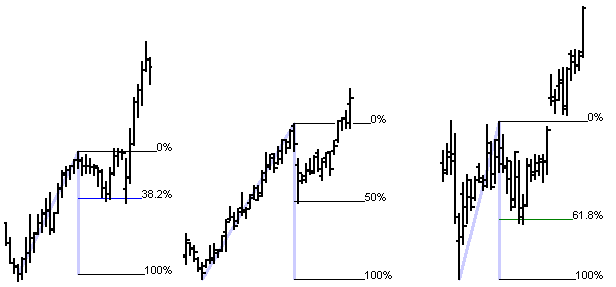
Upward Retracement
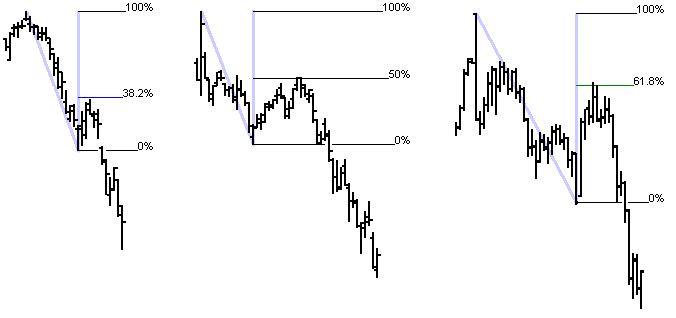
Downward Retracement
Frequently, the market will range between retracement levels (e.g., between the 50% and 62%). In such a scenario, you could use these levels to bracket the market and trade it as a breakout from a channel when the market finally commits to a direction.
Fibonacci History
Leonardo Fibonacci was a mathematician born around 1175 in Pisa, Italy. He died in 1250. In 1202, he investigated how fast rabbits could breed in ideal circumstances. Although this problem may not sound incredibly interesting, it opened a whole new avenue of ideas that have been the object of study over the past eight hundred years. Fibonacci de Pisa discovered a sequence of numbers where each number in the series is the sum of the two previous numbers. Some Fibonacci numbers are as follows: 1, 2, 3, 5, 8, 13, 21, 34, and 55.
To complete a Fibonacci sequence, take the previous number and add it to the current number, (e.g., 2+1 = 3). The sum is the third number in the series. The ratio of any number to its next highest number approaches 62% after the first four numbers. These numbers are used by technical analysts to determine price objectives from percentage retracements. The 38% retracement can be achieved by taking a previous number and dividing it by the next in the series. So, by skipping 34 and dividing 21 by 55, 38.2 percent will be achieved.
Fibonacci retracement is a popular technical analysis tool used by traders to help identify strategic locations for transactions, target prices, and stop losses. The notion of retracement is used in many indicators such as Elliott Wave theory, Tirone levels and Gartley Patterns. Numerous pieces of literature exist that outline the meaning and significance behind Fibonacci’s discovery.