The Decay window allows you to forecast the values of the option Greeks based upon changes in the underlying's price and volatility. The Decay window is designed specifically to forecast and show changes in an options Theta to allow the trader to maximize the rate of return in options positions such as a Covered Call, however the Decay window can also be used to forecast changes in other Greek values as well.
Decay Window
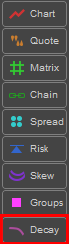
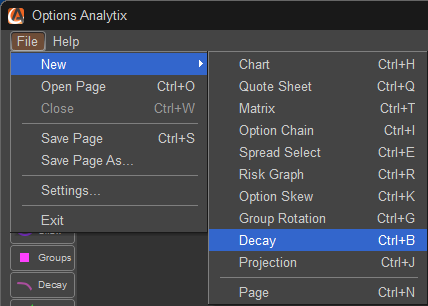
The Decay Window can be opened in multiple ways. The first methods is to move your mouse over the Decay button and press the left mouse button or click on FILE, select NEW, and choose Decay; you can also press CTRL-B on your keyboard.
Once the Decay window is loaded you can change the symbol by left clicking in the Symbol window in the upper left hand corner of the Decay Window. If you do not know the symbol there is a symbol lookup function which can be accessed by left clicking on the magnifying glass icon located to the right of the symbol field. Once the symbol is entered press ENTER or on your keyboard to load the Decay data.

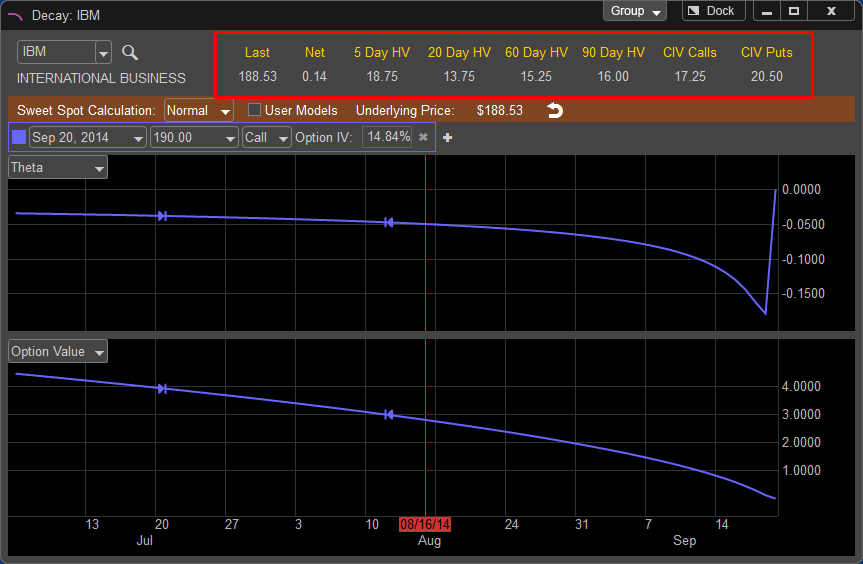
Now that the symbol is loaded the window should populate and the company name of the stock symbol you entered will appear directly below the symbol window. In addition, to the right of the symbol window you will be given the last price of the stock which is updated in real time along with the current value of 5, 20, 60, and 90 Day Historical Volatility as well as the Continuous Implied Volatility of both Calls and Puts.
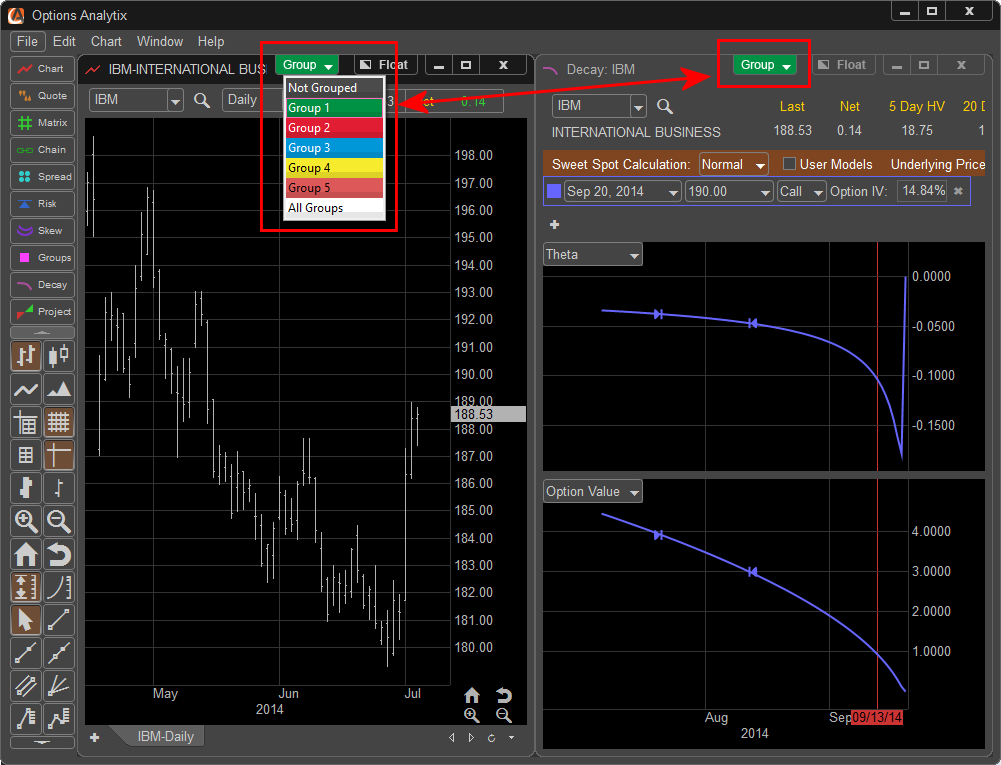
The Decay window can be linked with other windows within the application by left clicking on the Group button in the upper right hand corner of the window. This allows the Decay to sync with other windows within the application, for example if a symbol is changed on a chart the Decay will adjust to the same symbol if those windows are linked together.
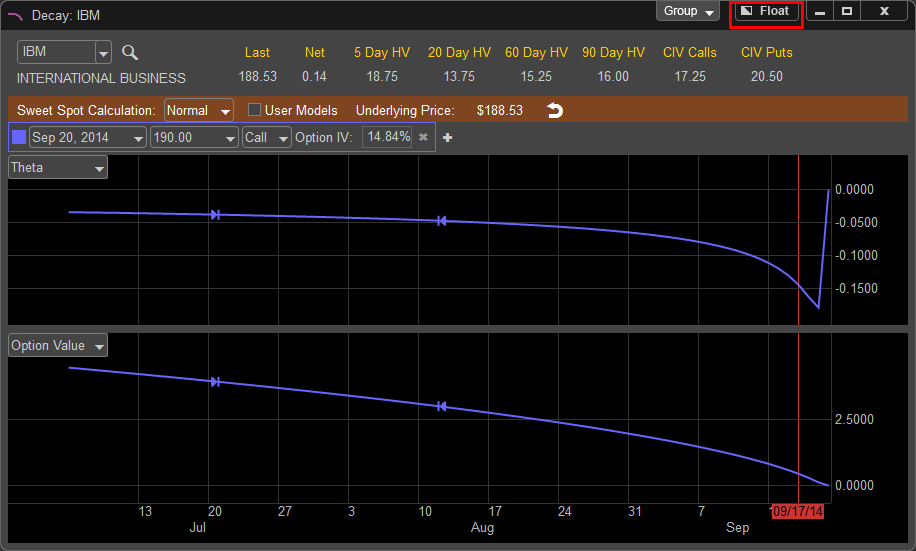
The FLOAT feature allows the window to be removed from the application and moved to a secondary monitor or another part of the desktop. This can be done by left clicking on the FLOAT button and moving the window manually. Once this window is in FLOAT mode the button will be relabeled as DOCK and can be pressed to return the Decay window back into the main application window.
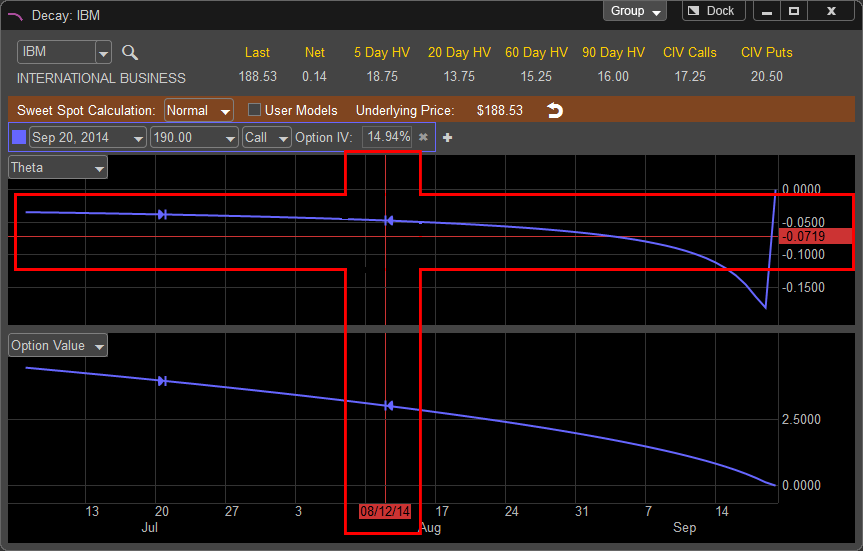
Vertical and Horizontal Cross hairs allow you to view detailed price and time information as you move your cursor along the Decay Chart. The Horizontal Axis represents time to expiration and the Vertical Axis indicates the Value of the selected Greek or Option Value. As you move your cursor back and forth and up and down the cross hairs will highlight the specific date the horizontal cross hair is on and the value the vertical cross hair is aligned to.
The Horizontal Axis can be adjusted by left clicking into the value price grid and holding down the left mouse button, move your cursor up to decrease the range of values displayed and move your cursor down to increase the range of values.
Decay Windows Features
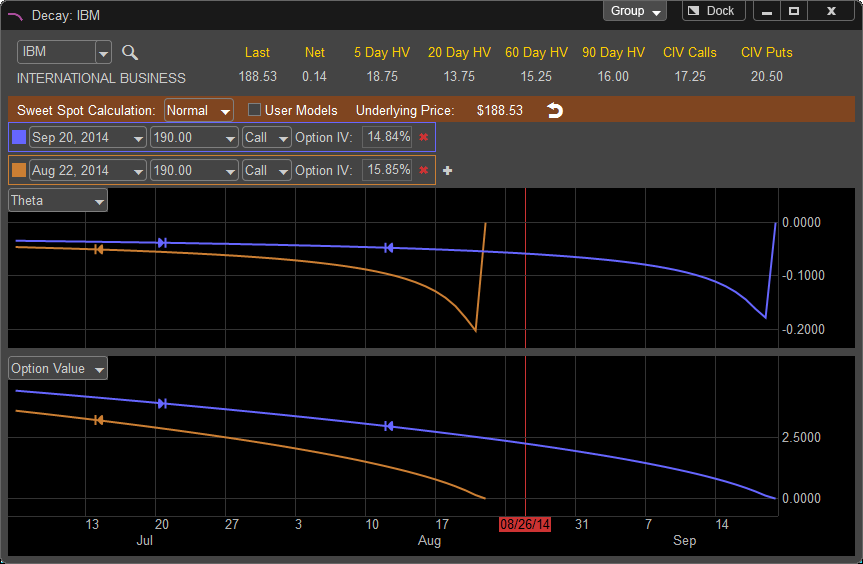
Once the symbol is selected the Decay window will populate the graph. By default the Option Contract listed is the first available expiration with a sweet spot calculation; typically this will be an option contract one month or more past the current expiration. The Decay window will have two panes, one for the Theta Decay and a second for Option Value.
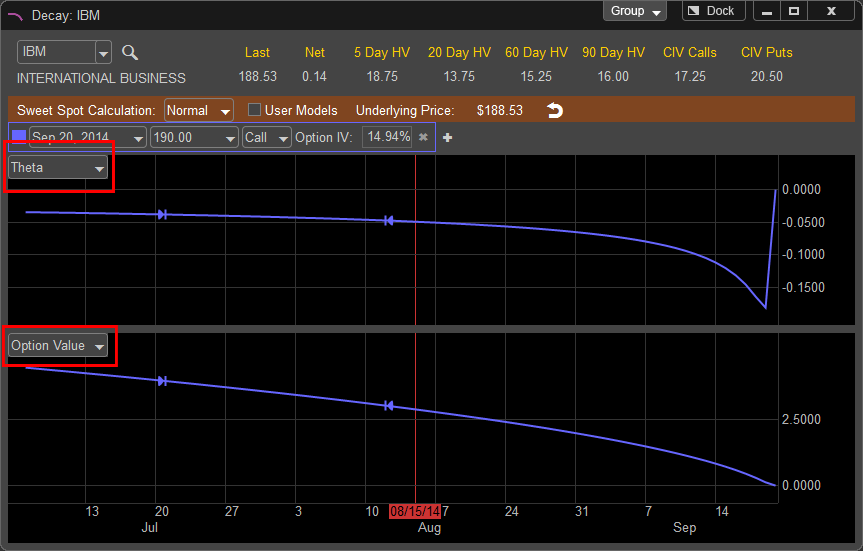
The Theta Decay pane is a visual representation of how the Theta values will change until the selected contract expires. The left edge of the Theta Line is the current real time value of the Theta on the contract. As you move your cursor to the right the cross hairs will show you the anticipated change in Theta as the contract moves closer to expiration. The Theta graph ends on the day the contract expires.
The Option Value Window represents the current price of the selected option price in real time. As you move your cursor to the right towards the end of the graph you will see how the value of the contract declines based on the Theta depicted in the upper pane. Remember, these values represent the price of the option contract without any change in the price of the underlying stock value.
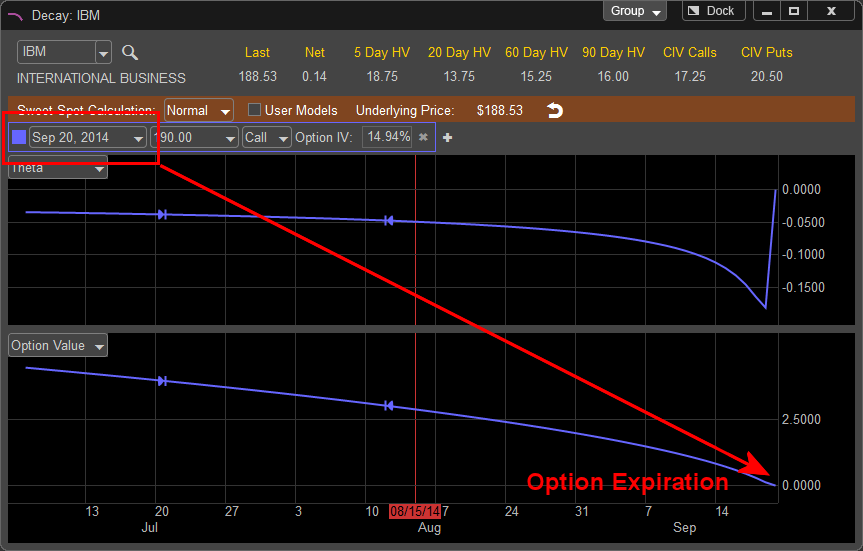
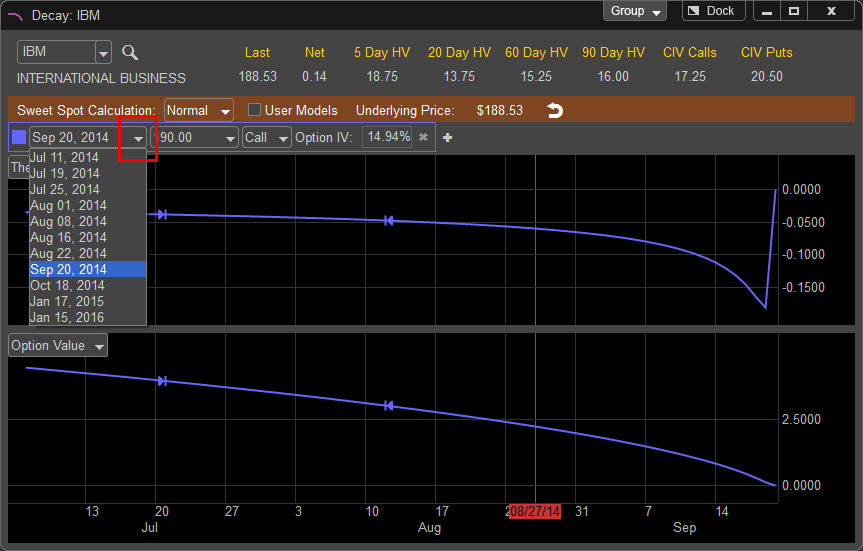
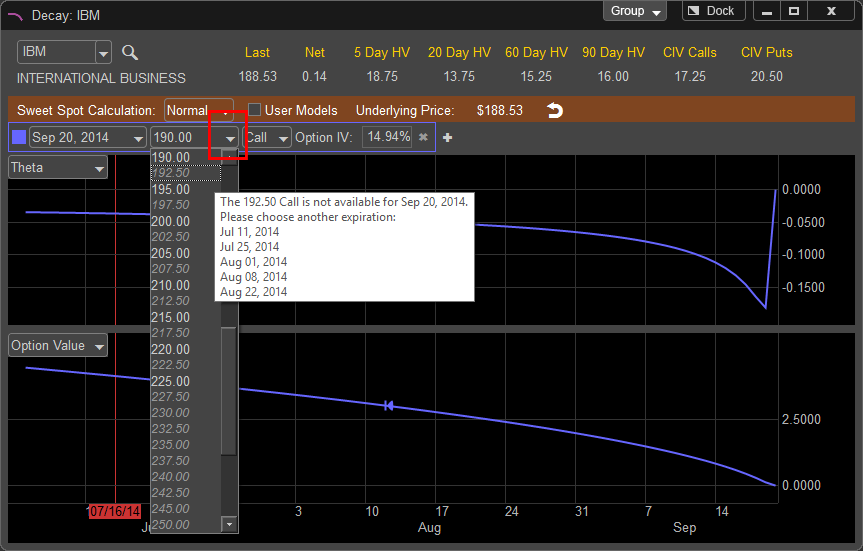
To edit the option contract being viewed you can change the expiration by left clicking on the currently displayed values of the option contract, you can change the expiration, strike price, and choose either the call or put.
If the strike price does not exist for the specified expiration date the price will be greyed out.
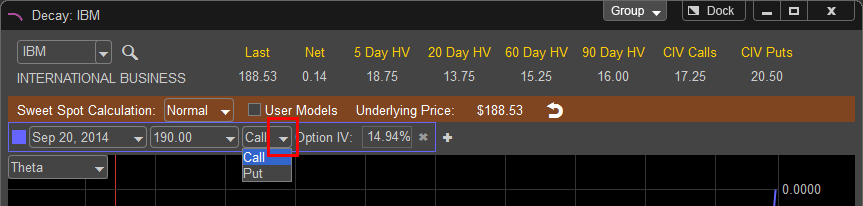
To choose a Call or a Put left click on the arrow to the right of the "Call" selection box.
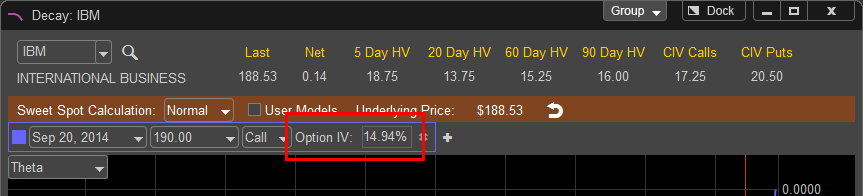
The Implied Volatility for the selected option is displayed in the Option IV field.
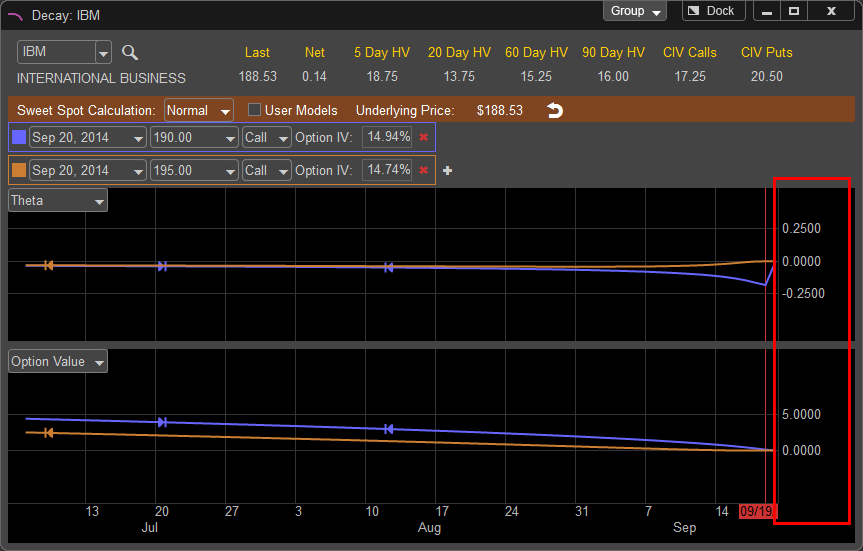
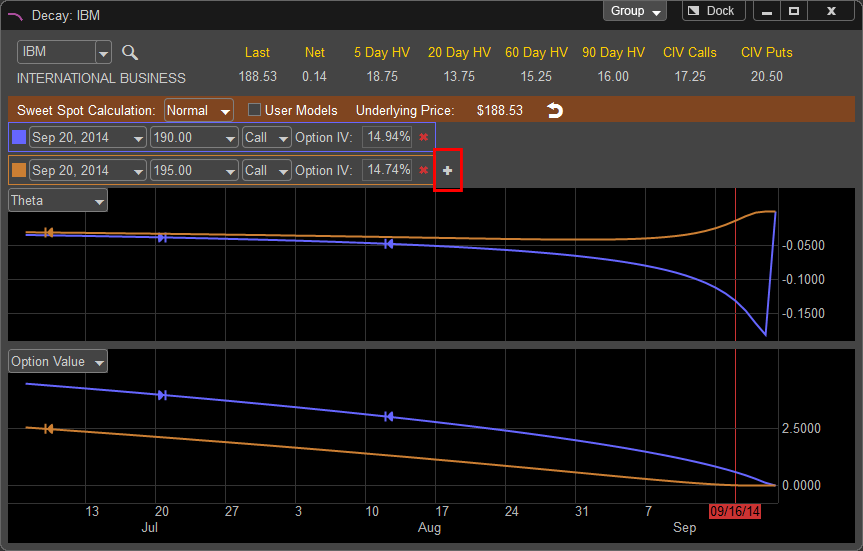
In addition, you can compare up to ten different option contracts by left clicking on the + next to the displayed option contract; this will bring up an additional field where you can select another contract. Once the new contract appears you can edit the expiration, strike price, and choose either the call or put from the new selection. The new contract will be represented on the Decay and Option Value Graph by the shaded background color surrounding the newly appearing option contract.
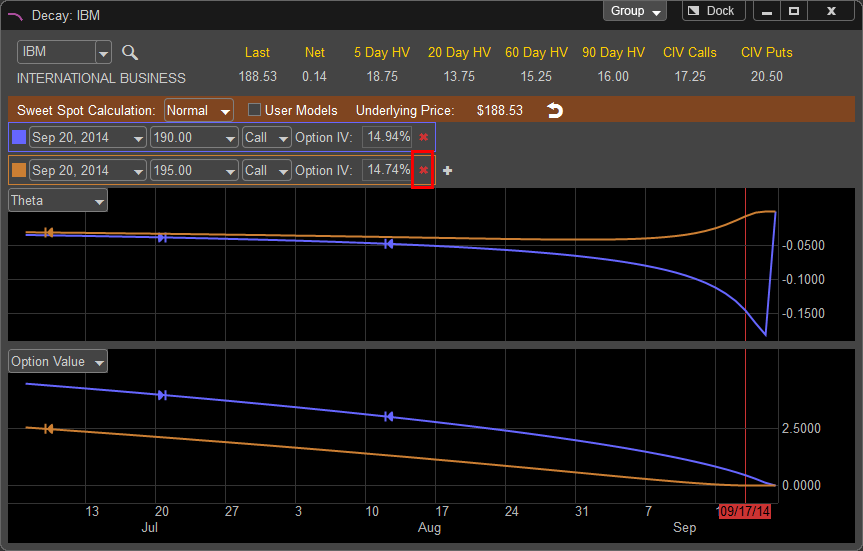
To remove the additional contract or contracts left click on the red X next to the right of the contract.
The Option Value panes are set as default to Theta and Option Value. If you wish to change the display to another Greek value, left click on the drop down menu in the upper left hand corner of the pane
you wish to change.
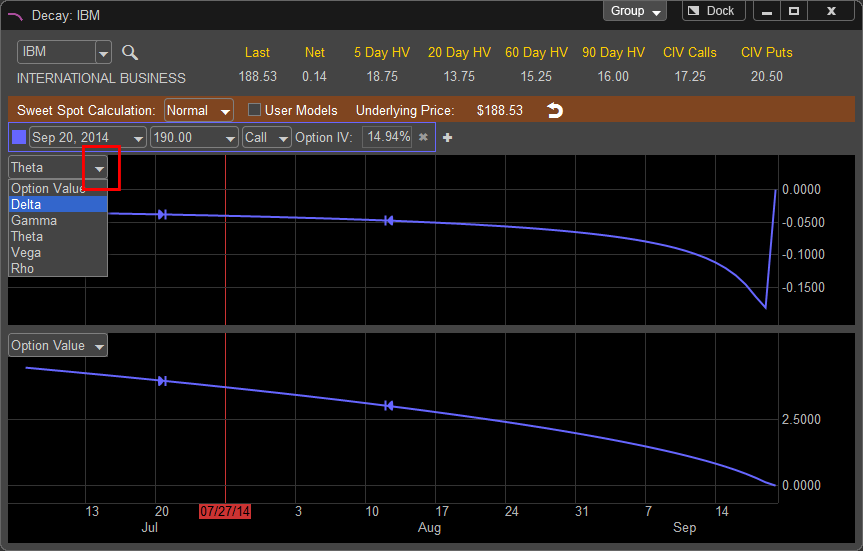
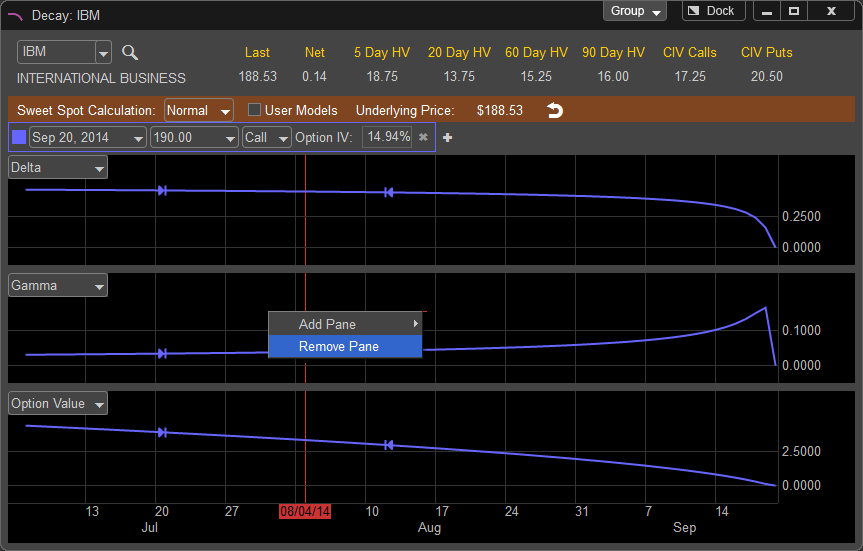
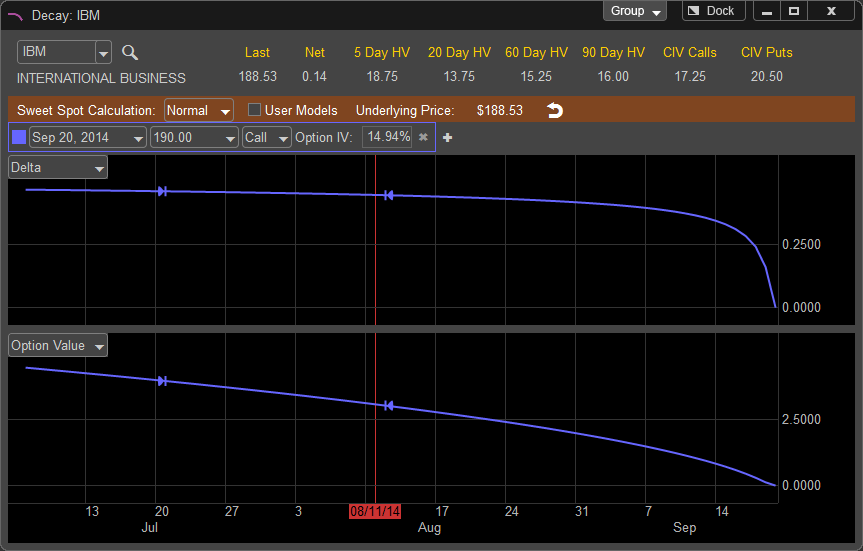
In this example we have changed the top pane to Delta and we can see how the value of Delta changes as the option gets closer to expirations. This assumes the price of the underlying issue does not change. If you wish to see how the Greek values and Option Values change with a change in the underlying's price and volatility you can simulate this in the User Models area of the Decay Window.
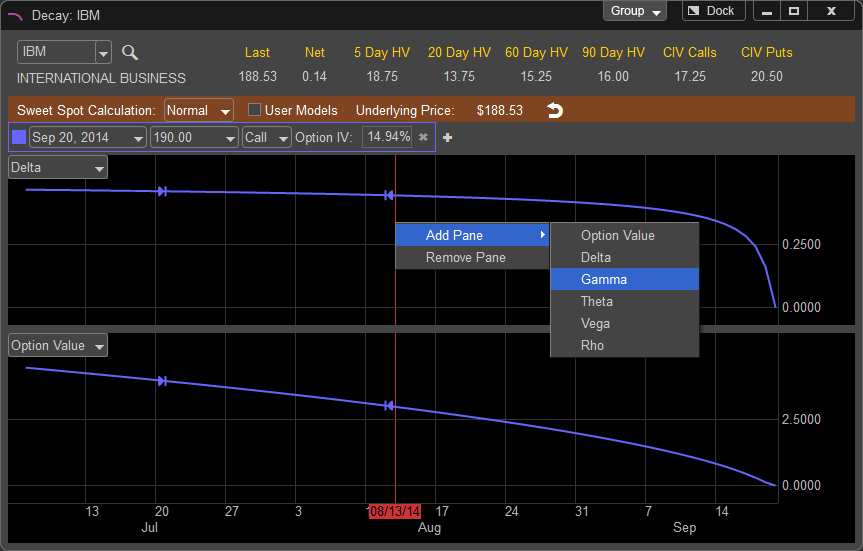
In addition, you can add a pane to the Decay Window by right clicking inside one of the panes and choosing "Add Pane" and choose the Greek or Option Value you wish to display.
A new pane displaying the selected options Gamma value is shown.
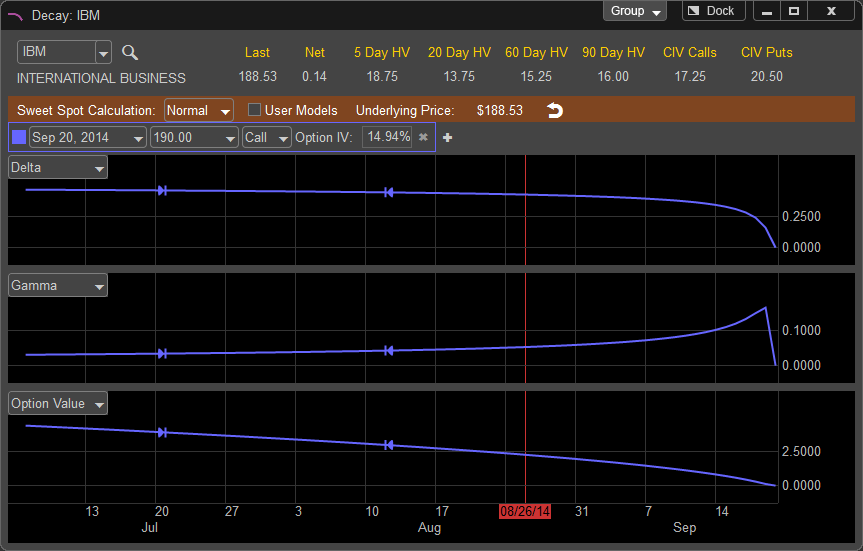
To remove the pane left click inside the pane you wish to remove and choose "Remove Pane"