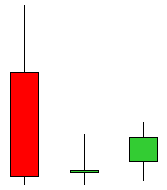
Bullish Daily Doji: This scan identifies stocks that have experienced a recent downtrend on the daily chart and, on the prior trading day, opened and closed at the same price. Additionally, the stock is experiencing current strength and is moving higher following the Doji, or same open and close price. This would indicate a reversal and potential movement to the upside.
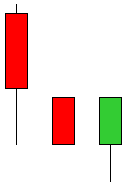
Bullish Engulfing: Bullish Engulfing patterns occur when a stock closes lower than is opening price during the period. The following period has a pattern of a higher high and lower low during the period, but closes above the prior period’s high. When these two consecutive period patterns are met, the stock lands on the Bullish Engulfing scan list and is a potential buy candidate.
Hammer: The hammer is a bullish reversal pattern that forms after a decline. In addition to a potential trend reversal, hammers can mark bottoms or support levels. After a decline, hammers signal a bullish revival. The chart pattern implies that sellers drove prices lower during the session. However, it also suggests a strong finish that indicates that buyers regained their footing to end the session on a strong note. While this may seem enough to act on, hammers require further bullish confirmation. The pattern on the hammer shows that plenty of sellers remain. A strong move to the upside after the hammer chart pattern is required for a stock to make this scan list.
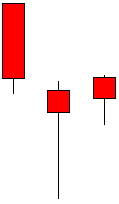
Bullish Harami: A candlestick chart pattern in which a large candlestick is followed by a smaller candlestick whose body is located within the vertical range of the larger body. In terms of candlestick colors, the bullish harami is a downtrend of negative-colored (black) candlesticks engulfing a small positive (white) candlestick, giving a sign of a reversal of the downward trend. Because the bullish harami indicates that the falling trend (bearish trend) may be reversing, it signals that it's a good time to enter into a long position. The smaller the second (white) candlestick, the more likely the reversal.
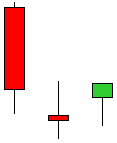
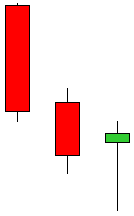
Morning Star: A bullish candlestick pattern that consists of three candles that have demonstrated the following characteristics:
1. The first bar is a large red candlestick located within a defined downtrend.
2. The second bar is a small-bodied candle (either red or white) that closes below the first red bar.
3. The last bar is a large white candle that opens above the middle candle and closes near the center of the first bar's body.
A morning star pattern can be useful in determining trend changes, particularly when used in conjunction with other technical indicators. Many traders also use price oscillators such as the MACD and RSI to confirm the reversal.