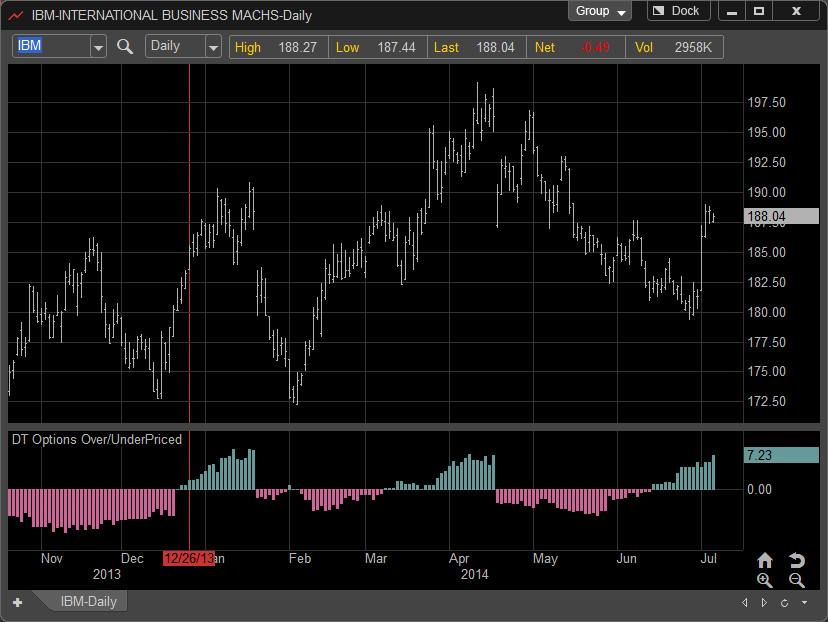
The DT Options Over/Underpriced Study is a histogram or line based comparison of Implied and Historical Volatility selected levels of a Stocks Volatility. Typically an options trader will compare Historical Volatility vs. Implied Volatility to gauge whether a stock has overpriced options or inexpensive options. The DT Options Over/Underpriced will take the two selected Volatilities and subtract the values and display the difference in a histogram or line form. In its default setting areas in ocean green represent higher priced options as Implied Volatility is greater than the historic and areas in dusty rose represent lower priced options due to lower Implied Volatility when compared to Historic.