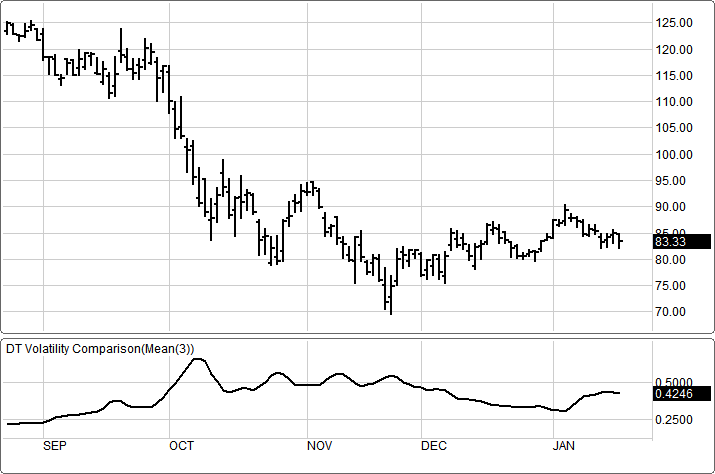
The Continuous Implied Volatility (CIS) can be shown as a line below the chart.
Menu:
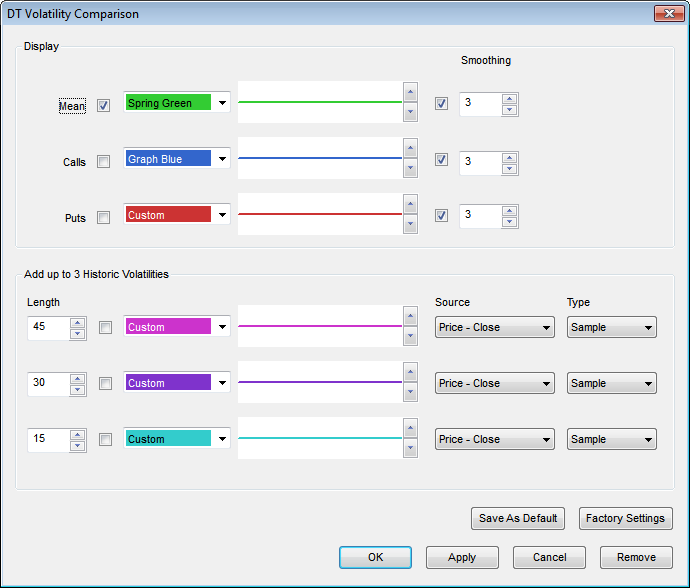
Display
Shows the settings for the Mean, Calls and Puts for the color and line thickness. To modify the Smooth using moving average choose the appropriate selection and change the number.
Historic Volatilities
Up to three Historic Volatilities can be added for further analysis.
To save your modified settings to be applied to future charts, click Save As Default. Once this is clicked at all times in the future the settings you have set will be applied to future charts when this study is added.
To return to the Factory Settings, click Factory Settings and then click Save As Default. Once this done at all times in the future the Factory Settings will be applied to future charts when this study is added.
Click "Ok" to apply the study to the selected chart, or click "Cancel" or "Remove" to exit the study without applying it.
Click "Remove" to remove the study from the selected chart.