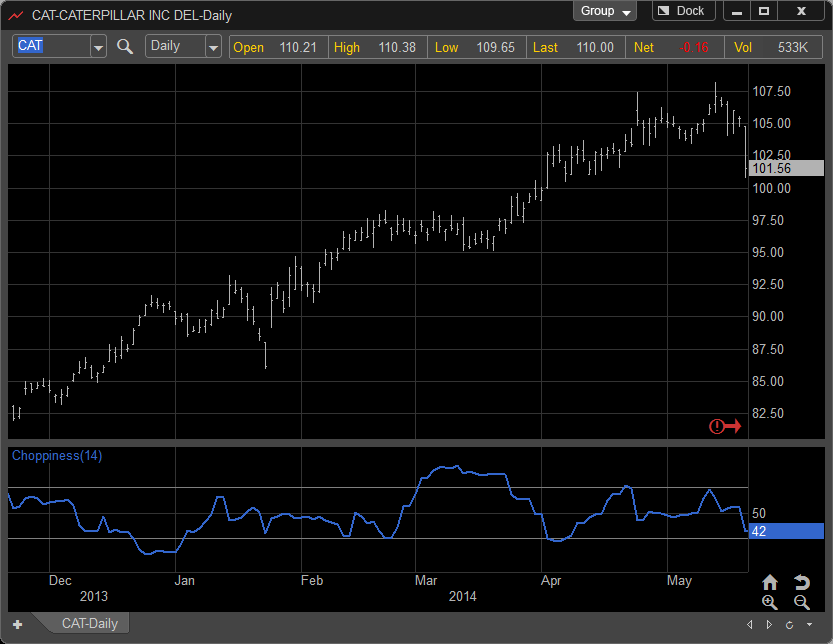
Choppiness as the name implies is an indicator designed to help identify "choppy" or range bound market behavior. The indicator is shown as a line graph with 2 bands dividing the study into three sections for analysis. The upper section which is any activity above the 61.8 band is interpreted as the area most likely to have the choppy or range bound market. As the indicator moves back below 61.8 and into the middle range the trends typically gain strength reaching their peaks as the indicator moves below the lower band of 38.2. When a market is in the strongest part of the trend the Choppiness indicator would be below the lower band.
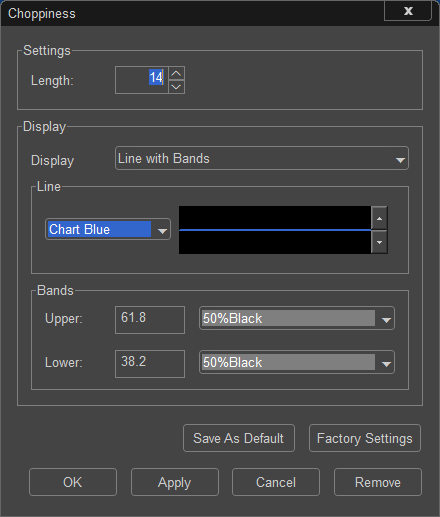
Choppiness Settings Dialog Box: