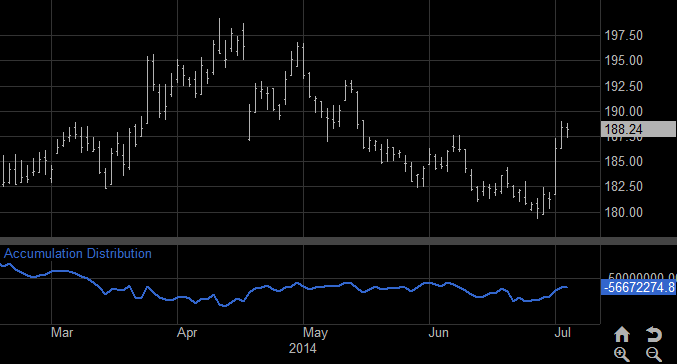
Accumulation Distribution is an indicator designed to track the relationship
between the price and volume. It uses volume to confirm trends and
can be particularly useful when it identifies divergence starting to setup
in a stock, index or futures contract.
Essentially what this calculation attempts to do is measure that market strength or general sentiment. It does this by trying to identify the commitment of bulls and bears to the market action by measuring the money flow in and out of the market.
The identification of early divergences between volume and price action is really where this tool becomes most helpful to traders.
You use traditional technical analysis tools such as Trendline and breakout analysis and contrasting this with how it intersects with the chart support/resistance levels.
If the market being tracked trends to new highs, for example, the Accumulation Distribution Index should also correspond with this behavior for that trend to continue. If divergence is setting up that could be a warning a possible change-in-trend could be forming. The same behavior should exist for either and up or down trend direction.
If divergence is spotted with the Accumulation Distribution Index, there are two general approaches: (1) bullish divergence means look to go Long; (2) bearish divergence means consider preparing to go Short, or if already Long start scaling out or trigger tighter trailing stops to protect those positions.
The name of this index, Accumulation Distribution, comes from the notion that accumulation buyers are in control and the price will be bid up or will make a recovery if sold down. Distribution implies the opposite behavior. The starting point is 0.
Menu:
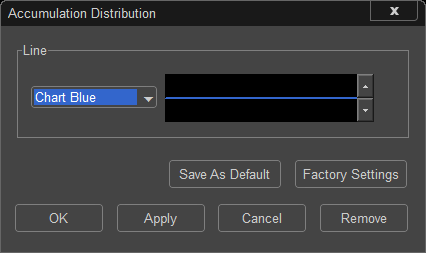
To modify the color or line thickness click in the appropriate locations in the Accumulation Distribution menu.
To save your modified settings to be applied to future charts, click Save As Default. Once this is clicked at all times in the future the settings you have set will be applied to future charts when this study is added.
To return to the Factory Settings, click Factory Settings and then click Save As Default. Once this done at all times in the future the Factory Settings will be applied to future charts when this study is added.
Click "OK" to apply the Average True Range to the selected chart, or click "Cancel" or "Remove" to exit the study without applying it.
Click "Remove" to remove the study from the selected chart.