As you select the spreads and choose the option configurations the Spread Select Window will constantly adjust the results. Once the desired configuration is reached you can examine each spread chosen in the results pane.
The results are listed in alphabetical order and broken down by strike price, lowest leg displayed first. The construction of the spread type and the following data is displayed for each spread constructed
Type – Displays the name of the Spread selected.
Long – For spreads requiring a long leg, this column displays the quantity of contracts required to purchase to complete the displayed spread.
Short - For spreads requiring a short leg, this column displays the quantity of contracts required to sell (write) to complete the displayed spread.
Strike – The stated price per share for which underlying stock may be purchased (in the case of a call) or sold (in the case of a put) by the option holder upon exercise of the option contract.
C/P – Indicates whether the option displayed is a Call (C) or Put (P)
Last – Last reported price of the option contract displayed.
Bid - The price at which an investor can sell to a broker-dealer.
Ask - The lowest price anyone is willing to sell a specific contract at a given moment in timem also called the offer.
IV - Implied volatility measures whether option premiums are relatively expensive or inexpensive. Implied volatility is calculated based on the currently traded option premiums. A mathematical formula, using stock price, strike price, time to maturity, interest rate and historical volatility, is used to arrive at the implied volatility number. An IV of 20 (20%) on a $100 stock implies that over the course of the next year the stock is expected to make a one standard deviation move of $20 (20% of $100). This means that within one calendar year there is a 68% probability (one standard deviation) that the stock will be priced between $80 and $120 per share.
Delta - Delta measures how much an option price will move relative to the underlying asset. It is the percentage change in the option premium for each dollar change in the underlying option. For example, a call option with a delta of 0.8 means for every $1 the stock increases the call option will increase by 80 cents. The Delta of a put is represented by negative numbers, a Delta of -.50 on a put indicates a decrease of $1 dollar on the underlying stock will result in an increase of 50 cents on the option.
Gamma - The rate of change for delta as it relates to the stock price. If the Gamma is .10 and the stock moves $1 per share the Delta of the option will either increase (stock moving up) or decrease (stock moving lower) by .10.
Vega - Vega is the sensitivity of the option price to changes in implied volatility. Vega measures the change in the option premium due to changes in the volatility of the underlying stock, and is always expressed as a positive number. A Vega of .20 indicates that the option price will move 20 cents for every 1% change in implied volatility regardless of how the underlying stock performs.
Theta - Theta measures the time decay in an option, or the amount of money an option will lose each day due to the time passing. Theta is the expected change in option price due to the passage of time. Theta is expressed as the loss of time value per day. Thus, a theta of -.1 indicates that the option is losing $.10 per day.
Prob ITM – The percentage chance the option has of being in the money at expiration.
Prob Brkeven - The percentage chance the option has of at the breakeven price at expiration.
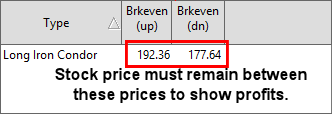
Brkeven (up) – The price at expiration the underlying stock must be at to have a no loss trade (minus commissions and fees).*
Brkeven (dn) - The price at expiration the underlying stock must be at to have a no loss trade (minus commissions and fees)*
* In the case of a neutral strategy where the stock must remain in a range to achieve profits this represents the price range at which the stock must remain in to maintain profits on the trade.
Max Risk – Maximum amount of loss the trade could cause, INF represents infinite.
Max Profits - Maximum amount of profits the trade could obtain, INF represents infinite.
Credit / Debit(-) – Represents the amount placing the trade will cost (based on current prices) in the case of a debit spread or return to you for credit spreads. Numbers in red are debits to your account and blue represent credits. This does not take into account fees, commissions, or slippage.