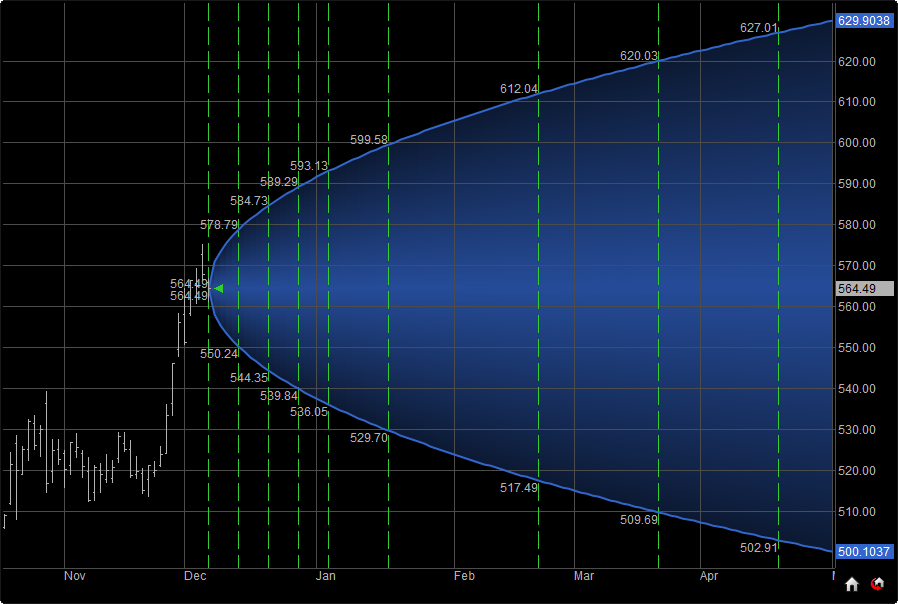
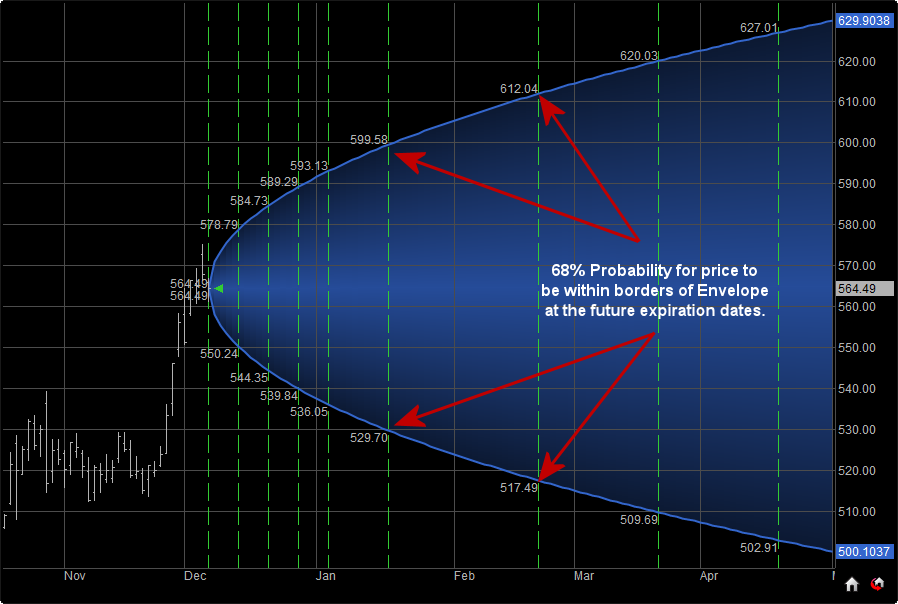
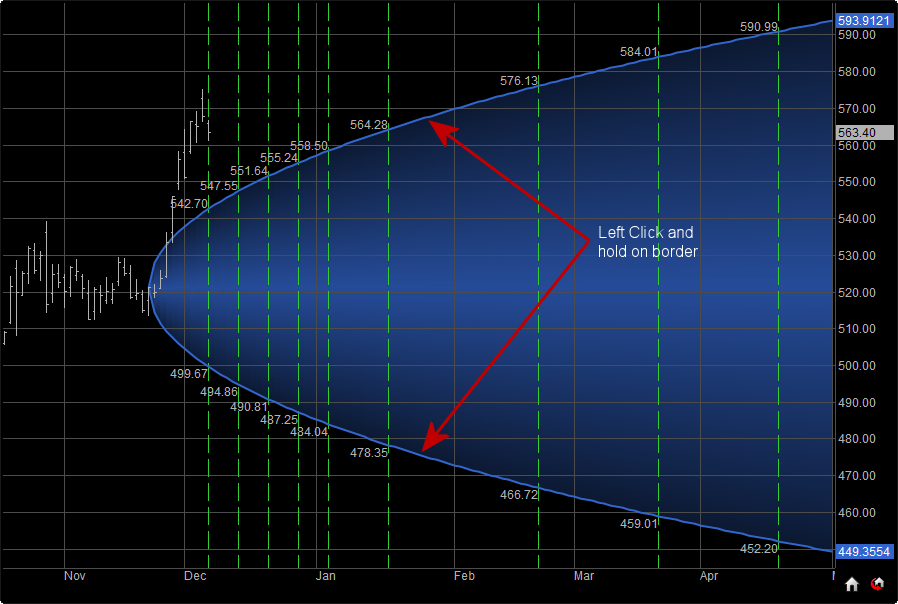
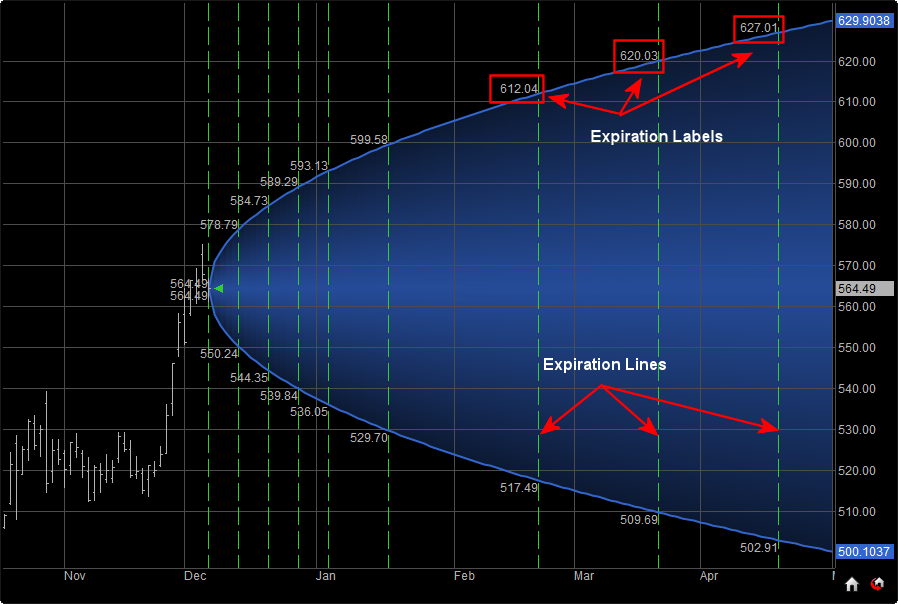
The primary use for the Probability Envelope is to give the trader a visual reference for probability that a market will be trading within a certain price in the future. For example, on this chart of AAPL a Probability Envelope of 68% or one standard deviation (default setting) is illustrated. The interpretation is that throughout the length and width of the Envelope the market has a 68% Probability of prices staying within this range. As time increases so does the price range at which that market has the Probability of reaching.
The green vertical bands represent the expiration dates of the available option contracts .These are helpful to option spread traders as it helps you visually set the limits of both strike prices and expiration dates of the contracts in your spread to help maximize profitability.
Probability Envelope Properties
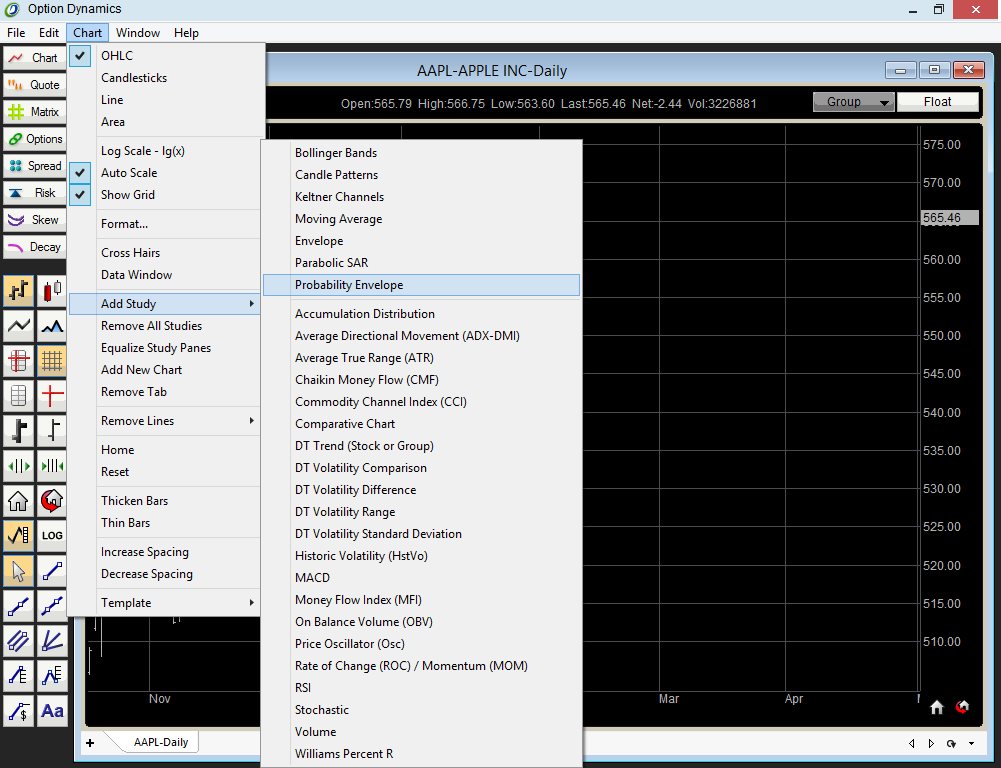
To add the Probability Envelope to your chart right click on the chart and select Add Study and Probability Envelope.
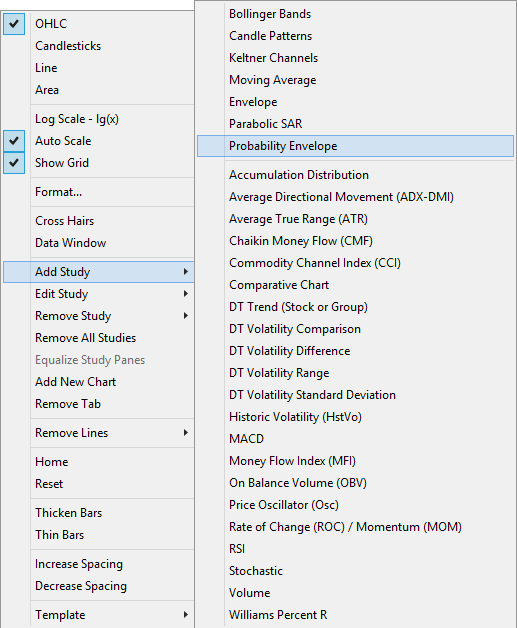
In addition you can also add the Probability Envelope to your chart by left clicking on Chart from the Chart Menu at the top of the Options Analytix Screen and selecting Add Study and Probability Envelope.
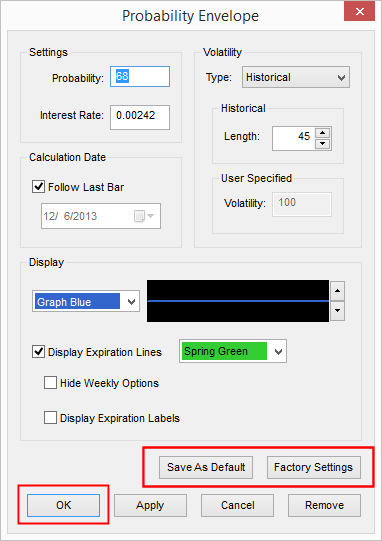
Once selected the Properties Window will appear, from this window you can adjust the various settings of the Probability Envelope.
Menu:
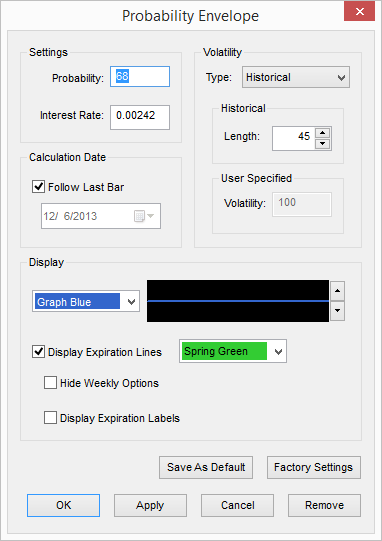
Settings:
Probability – The default settings is set to 68% or one standard deviation, this can be adjusted by left clicking in the text box and manually typing in a new value.
Interest Rate – The default setting is based on the 30 Day LIBOR Rate but can be adjusted manually by left clicking in the text box and manually typing in a new value.
Volatility:
Type: The default Probability Envelope is based on a 45 Period average of Historical Volatility, however it can also be set to a user specified value based on either a user selected length of Historical Volatility or a user entered value of Volatility. To adjust the Length of the Historical Volatility used you can either left click on the arrows to the right of the Length box or manually enter a value in the text box.
To change from Historical Volatility to a User Specified Value right click on the drop down menu next to Type and select User Specified. Once selected the User Specified Volatility window will become active and a value can be entered manually in the text box.
Calculation Date:
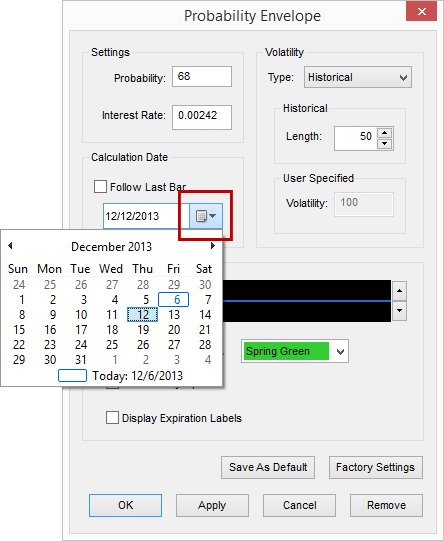
By default Follow Last Bar is checked and the Probability Envelope will calculate from the current bar. If you wish to backdate the Probability Envelope you can change the date by left clicking and unchecking the box marked Follow Last Bar and then left clicking the dropdown menu to the right of the calendar. Select the date that you would like to start the Probability Envelope from and click OK in the lower left corner of the Properties Window to apply the changes to the chart.
In addition you can also adjust the Calculation Date from the chart by holding down the left mouse button on the border of the Probability Envelope and dragging the Envelope to the desired date. Once the date is reached release the left mouse button.
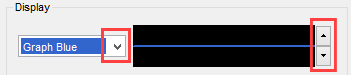
Display:
The Display option can be used to change the color scheme of the Probability Envelope by left clicking the arrow to the right of the color selection menu. You can also adjust the thickness of the border by left clicking on the up and down arrows to the right of the display line.
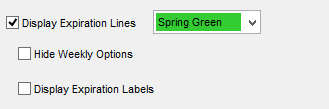
Expiration Lines are displayed by default as Green Vertical Dashed Lines, these can be toggled on and off by toggling the check box to the left of Display Expiration Lines. In addition the color can be adjusted by selecting a color from the drop down menu to the right.
Also available is the choice to hide Weekly Options, to hide the Weekly Expirations place a check mark in the box to the left of Hide Weekly Options. You can also toggle the expiration labels by placing a check mark in the box to the left of Display Expiration Labels.
Once the Properties are adjusted you can make the new settings the default by left clicking on the Save As Default button. If you desire to return to the factory settings left click on the Factory Settings button, if you wish to restore the defaults to
Factory Settings, click on Save as Default after clicking on Factory Settings. Once any changes are made to the Properties click OK to apply them to the Chart Window.