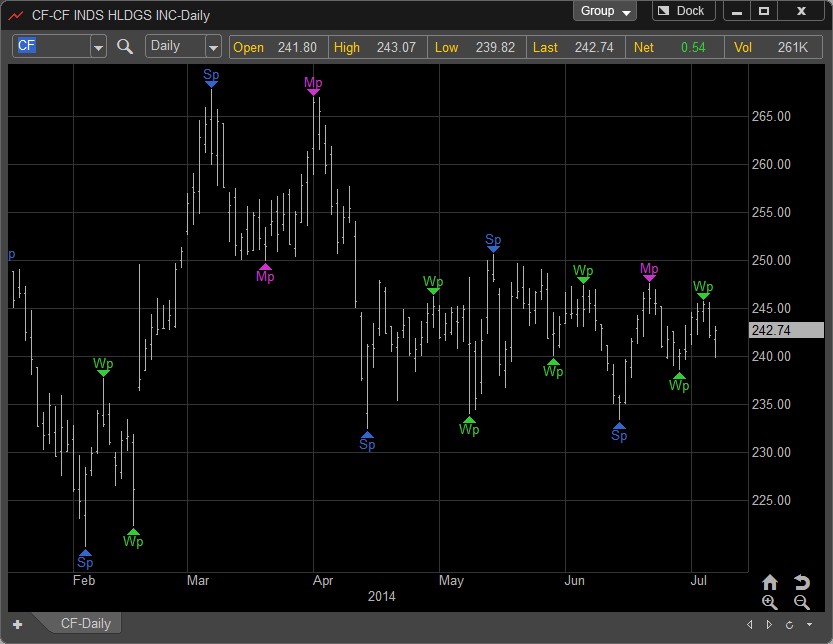
Pivot points are price turning points where a price reverses at a support or resistance level on a chart. The pivot point is the peak or through level at which the market changes direction. Some refer to pivot points as the “swing” numbers.
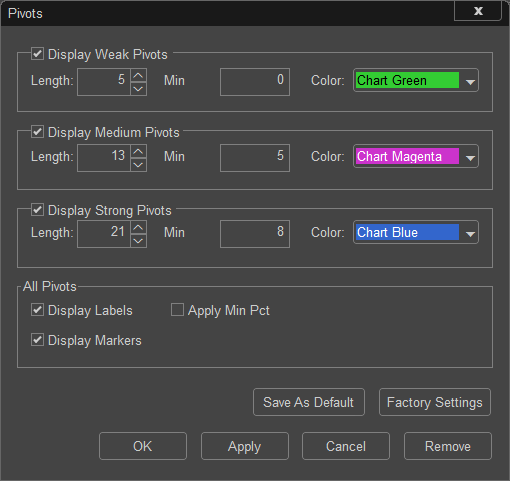
The strength of a Pivot is based on how many bars forward and backwards the software looks for previous price highs and lows. For example a Strong Pivot High can only appear at a minimum of 21 bars apart, the Medium 13 bars, and the Weak 5 bars. When a Strong Pivot high is identified on the chart the software will look forward a minimum of 25 bars and if the market takes out that Pivot High a new Strong Pivot can be placed.
You will never a see a Pivot on the last bar of the chart as the weakest Pivot Point is based on 8 bars and we must have at least 8 bars from the current price to identify a pivot.
Among the many uses for Pivot Points there are two that are the most widely used. First we can use them solely as a method of identifying previous levels of support or resistance. For example, if you identify a Strong Pivot High in the past typically the market will have a more difficult time passing through that area in the future and price movement can stall around that area.
Second, Pivot Points can be used as anchor points for drawing tools such as Fibonacci Levels, Trend Lines, and Regression Trend Channels. You may often hear traders talk about drawing levels and lines from the “Recent Pivot Low.” The Pivot tool calculates these areas for you and allows you to quickly draw your lines.
Pivot Setting Dialog: