Definition: A moving average indicator is used in technical analysis to show the average value of a stock, commodity, index, or anything tradable over a specific period of time. By taking an average of a given symbol, it essentially smoothes out market fluctuations and short-term volatility-thus giving some indication on which way it is trading over a specified time. The moving average is a very helpful and easy tool to use for trading and direction identification.
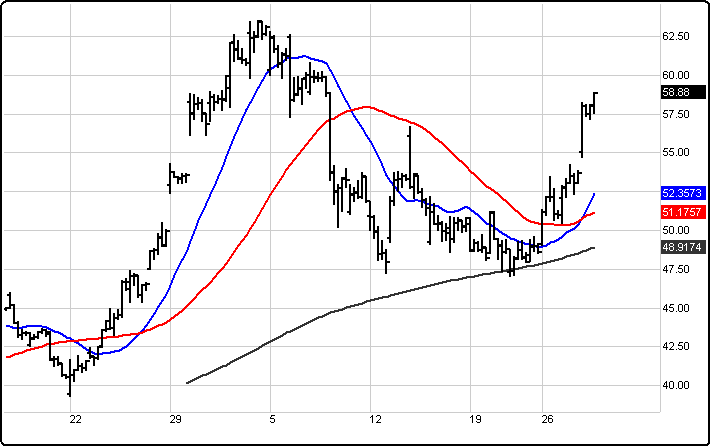
Short-term moving averages typically respond more quickly to changes in the price, while long-term moving averages are slower to react. That is one reason many traders recognize the value of tracking a variety of moving averages. Some common moving average periods are as follows: 20, 50, and 200. Breaks in key moving averages can be used to identify temporary and/or long-lasting changes in a trend as shown below.
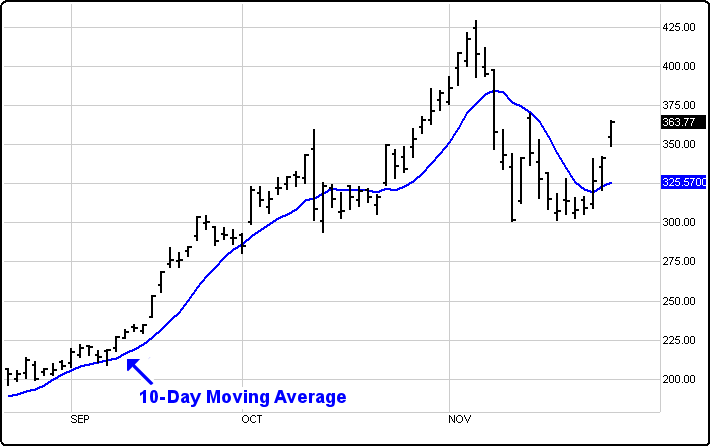
A simple example of a moving average is a 10-day moving average calculated by adding the closing prices for the last ten periods and dividing the total by 10. (Most individuals use the close only data in their calculation. Some use other prices such as Open, High, Low, or even combinations of these variables.)
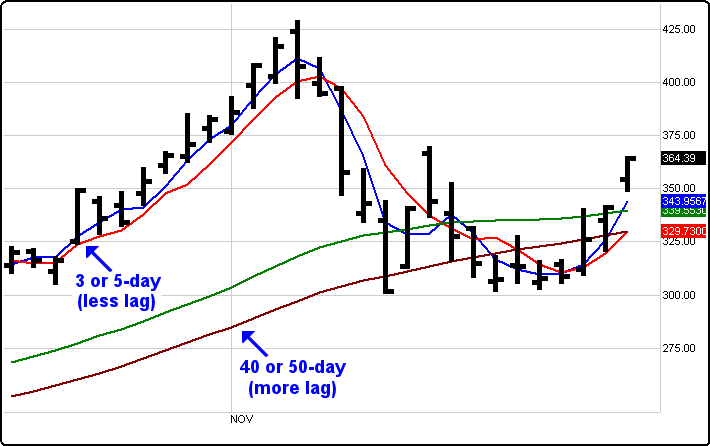
Moving Average Lag: The moving average line is considered a lagging indicator because it lags market action. If we use a shorter period moving average such as a 3 or 5-day, the lag factor is reduced, and a potential change in trend might be recognized sooner. However, the shorter period moving averages also tend to introduce noise causing frequent false signals.
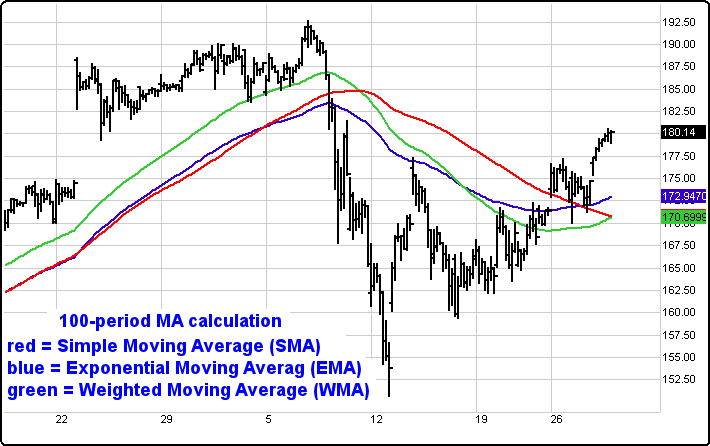
The most common moving averages are as follows: Simple, Weighted, and Exponential Moving Averages.
Simple Moving Average (SMA) - The SMA is calculated by dividing the sum of numbers by how many numbers are present (the close price is used most often); the SMA represents market action for a specified period of time. The SMA assigns equal weight to each data point in the period. As new data is added, older data is ignored. With these numbers, if plotted out, a line connecting the averages effectively smoothes out recent market volatility and creates a smooth line of the average. The downside with the SMA is that it may tend to lag.
Exponential Moving Average (EMA) - The EMA is calculated by weighing recent values more heavily than older values. It assigns greater importance to recent data and is a form of a Weighted Moving Average (WMA) where the weight decreases exponentially. The difference between a SMA and EMA is that the EMA is consistently closer to the actual price. It can be used to reduce the lag in simple moving averages.
Weighted Moving Average (WMA) - The WMA is calculated using recent data which is more relevant than past data. This moving average assigns different weights to values or periods as opposed to assigning an equal weight as does the SMA. More weight is given to the recent periods by multiplying the recent data by a given number, adding the result to the overall calculation, and multiplying the next most recent data by a lesser number. The WMA is considered more responsive to recent market activity than the SMA.
How to Use: Moving averages, in its most basic form, can provide support or resistance. The longer a moving average holds, the stronger the trending potential becomes. However, when a moving average that has held for a long period of time breaks, the break is seen as more significant, and the potential for a trend reversal is greater.
The SMA is generally regarded as one of the best and most simplistic moving average to use in terms of trading results. Some believe a WMA makes the indicator overly sensitive and negates the original purpose of the moving average which is to smooth out market action. If the market is experiencing a larger move, an EMA or WMA should be considered. The WMA or EMA can generate more trades within tight ranges.
A crossover of a single moving average is one technique for trading moving averages. Another technique is crossovers of different averages to signal potential early stages of a new trend.
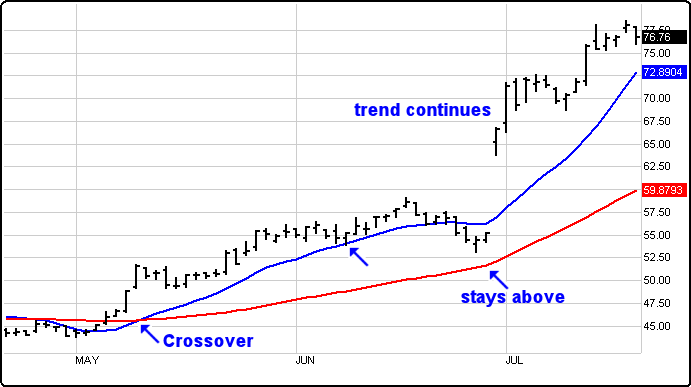
Multiple Moving Averages - A moving average used alone may not be a consistent or highly effective tool for identifying support and resistance. Using combinations of moving averages for tracking support and resistance can be helpful. For example, a break of the 50 period moving average indicates that a smaller trend is vulnerable to more pullback; however, as long as the 200 period moving average holds as a support or resistance area, the bigger, overall trend still can return.
Menu:
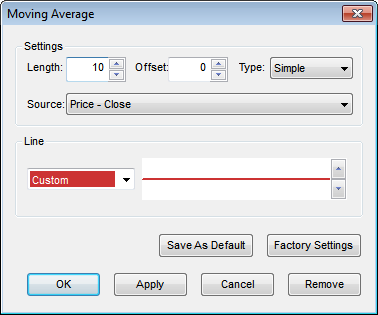
Settings
The Default Length is 10 (trading days) and the Offset is 0. These values can be changed by clicking in their respective boxes and changing the values. The Type can be changed from Simple to Exponential or weighted.
The Source can be set to one of the following options: Price - Open, Price - High, Price - Low, Price - Close.
Line
The Color selection allows the user to change the color of the band & the Thickness selector allows the user to change the thickness of the band displayed.
To save your modified settings to be applied to future charts, click Save As Default. Once this is clicked at all times in the future the settings you have set will be applied to future charts when this study is added.
To return to the Factory Settings, click Factory Settings and then click Save As Default. Once this done at all times in the future the Factory Settings will be applied to future charts when this study is added.
Click Ok to apply the Moving Average to the selected chart or click Cancel or Remove to exit the study without applying it.
Click Remove to remove the study from the selected chart.