Keltner Channel is a technical analysis volatility indicator that incorporates the Envelop Theory when trying to identify overbought or oversold conditions, or overall trend strength in a stock or market. It can also help identify price breakout moves. The unique quality of Keltner Channels is it uses the concept of Average True Range, and its sensitivity helps it identify volatility as a useful trading tool.
The Envelope Theory holds that price has the greatest probability of falling within the boundaries of the envelope. The basic category of a typical envelope formation will consist of three lines– the middle line, followed by two upper and lower outer lines.
Keltner Channels was first mentioned in the early 1960’s as a trading technique by Chester W. Keltner in his book, "How To Make Money in Commodities." Later Perry Kaufman expanded on the understanding of how to apply Keltner Channels to trading in his book, "The New Commodity Trading System and Methods."
The Keltner Channel indicator is not limited to one time frame. It can work well on many time frames. Preferably, the more trending a market is, the better chance for success using Keltner Channels.
Keltner Channel Momentum Signals
The original way of trading Keltner is to monitor for a buy when the close exceeded the upper channel and for a sell when the close was below the lower channel. This penetration identifies strong bullish or bearish momentum.
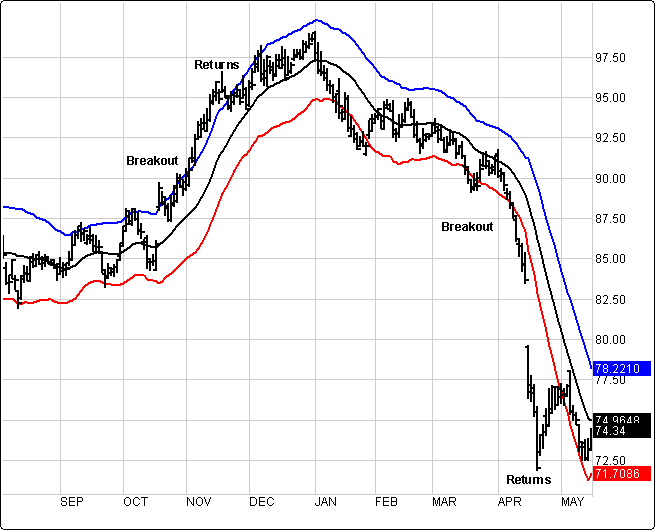
In the following example we first see a breakout buy to the upside where IBM starts to stretch outside the band in early November 2004 and it stays outside for a couple weeks before returning. When the price pulls back within the band it warns momentum is now dissipating and the opportunity may have run its course, so it is time to protect that position or take profits. We see a minor break after a top with its limited opportunity. Two months later we see a strong breakout to the downside which offers a more significant Sell opportunity before later returning back into the envelop. Taking this Keltner Short signal would have lead to a very rewarding trade.
If a market is not in a strong trend it is possible to use Keltner Channels to trade the internal price swing moves.
Keltner Channel Overbought and Oversold Signals
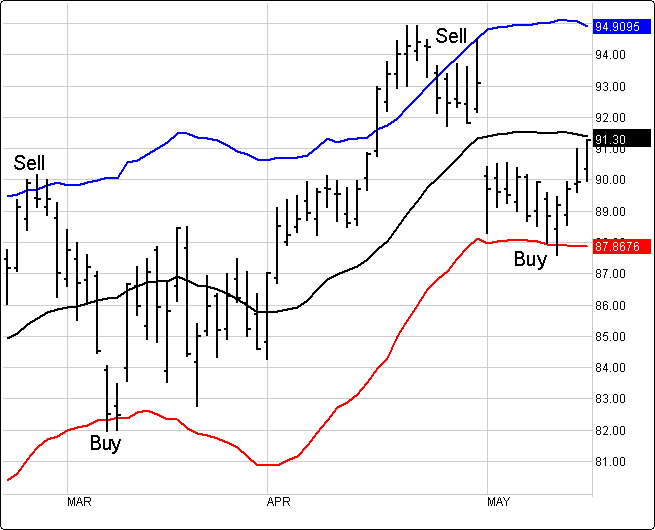
The Keltner Channel breakout methodology works well in strongly trending markets, but what happens when that market is contained in an oscillating or range bound market? Keltner Channels can be very useful in trading a directionally challenged market as well. Simply look for traditional overbought and oversold conditions, or swing moves to the upper or lower Keltner Channels that can be traded.
Menu:
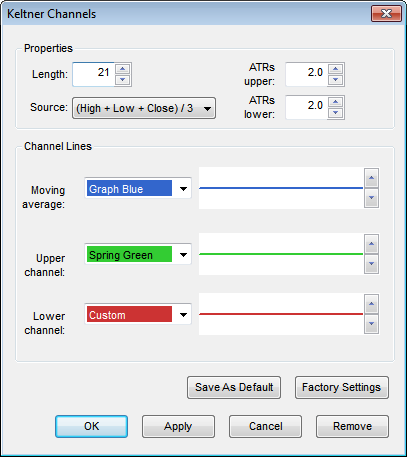
Properties
Length: To modify the Length (days) use the up or down arrow or type a number in the field.
Source: Choose from Price - Open, High, Low, Close or (High + Low) / 2.
ATRs Upper: This allows the user to modify the upper band.
ATRs Lower: This allows the user to modify the lower band.
Line
The Color selection allows the user to change the color of the band & the Thickness selector allows the user to change the thickness of the band displayed.
To save your modified settings to be applied to future charts, click Save As Default. Once this is clicked at all times in the future the settings you have set will be applied to future charts when this study is added.
To return to the Factory Settings, click Factory Settings and then click Save As Default. Once this done at all times in the future the Factory Settings will be applied to future charts when this study is added.
Click "Ok" to apply the study to the selected chart or click "Cancel" or "Remove" to exit the study without applying it.
Click "Remove" to remove the study from the selected chart.