Chaikin Money Flow (CMF) was developed by Marc Chaikin to determine the degree that money is flowing in or out of a particular stock.
Selling pressure is produced by increased volume and frequent closes in the lower half of the daily range. The CMF does not use the close price like Joe Granville’s On Balance Volume indicator, nor does it use the open price like Larry Williams’ calculation. It uses the mid-point of that time period’s range.
Chaikin posits that if a security closes above the mid-point, it indicates strong accumulation. If the security closes below the mid-point, it would suggest that a distribution is occurring. If the security closes in either the top or bottom half, the calculation would add or subtract the volume.
The CMF uses accumulation and distribution in its calculation. The CMF is normally calculated by finding the sum of accumulation and distribution for 21 periods and then dividing by the sum of volume for 21 periods. The closing location value multiplied by volume forms the accumulation/distribution value for each period.
Traditional money flow techniques examines both price and volume activity. It is similar to RSI, which looks only at price. Money Flow, as a theory, demonstrates a relationship between price movement and the actual amount of money flowing in or out of a stock, bond, or commodity. The belief is that as money goes in or out of a security, a measurable, predictive, and usable pattern should exist. By measuring the amount of net money movement, supply and demand trends can be qualified and better identified as attractive or overpriced. Essentially, one is measuring whether investors are paying more or less than market price.
Traditional Money Flow analysis identifies divergences between trends in price and trends in money flow. If the price goes up, money should be flowing into it. If the price goes down, money should be flowing out. When price is trending higher, money flow should be trending higher. When price is trending down, money flow should be trending down. Bearish divergence occurs when the price is trending higher, and money flow is falling. Bullish divergence occurs when the price is trending lower, and money flow is increasing. Price usually corrects in the direction of money flow. The key to using the CMF indicator is similar to the standard Money Flow indicator: Look for divergence between the price action and the CMF oscillator. If the security is going up while the CMF is heading down, it could be a topping action. If the security is trending down while the CMF is bottoming out or begins to move up, the security may be ready to transition and reverse back up.
The CMF can have difficulty accounting for gapping or unusually high or low price moves.
The CMF signals accumulation when the indicator line moves above zero and distribution when the indicator line moves below zero. The higher the CMF reading above or below zero location, the better or stronger the signal. The Chaikin Money Flow is bullish when it is positive and bearish when it is negative.
Another area of interest is the CMF oscillator range or the length of time the CMF has remained in a positive or negative mode. Sometimes divergences may be harder to qualify, but by looking at the extreme levels and tracking the general direction of the oscillator, similar inferences can be made even when the divergence is vague.
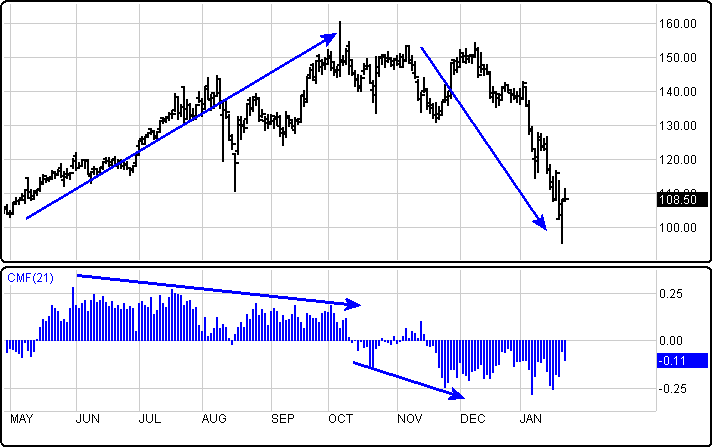
Below is an example of a negative divergence occurring in Precision Castparts (PCP) and its CMF. As the stock was beginning to plateau, the CMF was declining. Money was flowing out. A strong break of the zero line can be identified. The next rally became a top, and previous selling eventually won out. The stock price is now strongly trending down.
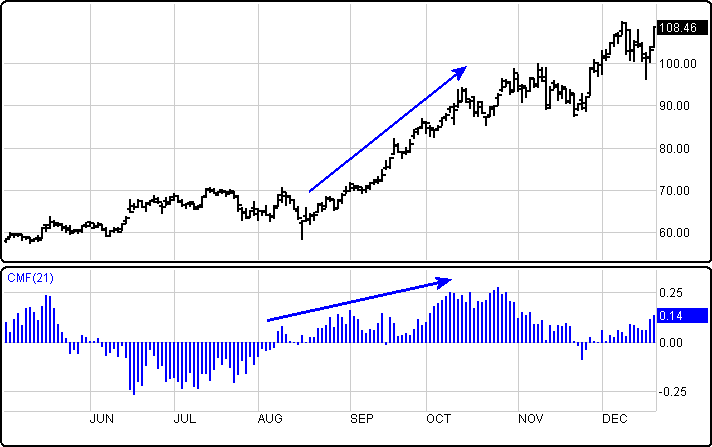
In the Monsanto (MON) example, money flow crossed zero and continued to rise while the price started trending. This trend continued for several months as the money flow continued to increase during this time. This is the sign of a sustainable trend up in progress.
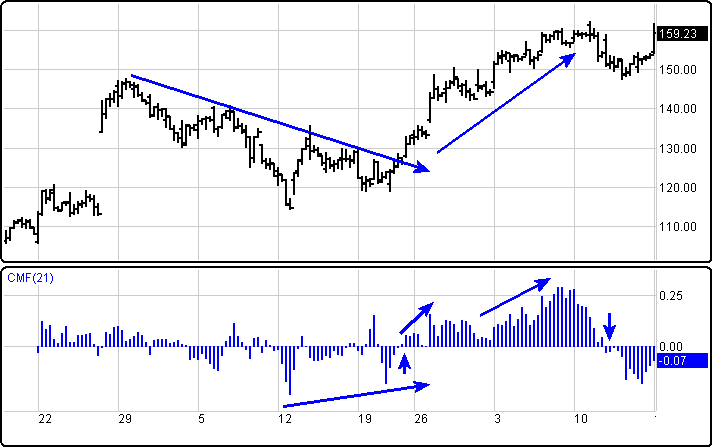
The Deckers Outdoor (DECK) 120 minute chart example depicts a stock going through a one-month correction with limited money flow. In mid-November, a more obvious positive money flow is evident where the strength grows more after crossing the zero line. Once the zero is crossed again in December, the stock retraced and then rallied again. During this last rally, one would begin to reduce his or her position if using the CMF because the reduction in money flow to a negative value hints a possible top could be approaching.
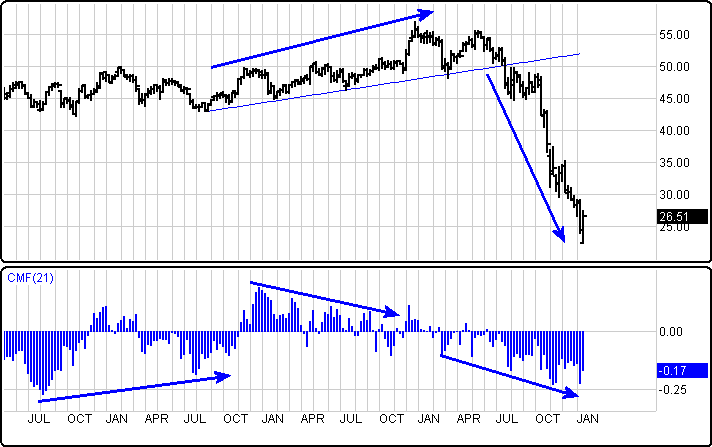
The Citigroup (C) weekly chart example depicts positive divergence from 2004 to 2005 where the stock range traded for the next two years before selling off again in 2007. Negative divergence set up by the fall of 2006 and led to greater money flow weakness that began to grow weaker in the following six months. Finally, a technical breakdown coupled with greater weakness is evident.
Menu:
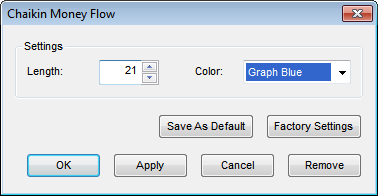
Settings
The Default Length is 21 (trading days) and can be changed by clicking in the appropriate box and changing the value.
The Color selection allows the user to change the color of the study.
To save your modified settings to be applied to future charts, click Save As Default. Once this is clicked at all times in the future the settings you have set will be applied to future charts when this study is added.
To return to the Factory Settings, click Factory Settings and then click Save As Default. Once this done at all times in the future the Factory Settings will be applied to future charts when this study is added.
Click “OK” to apply the Study to the selected chart, or click “Cancel” or “Remove” to exit the study without applying it.
Click “Remove” to remove the study from the selected chart.